20. Trading Backtest
Download PDFTrading Backtest
Learning Goal
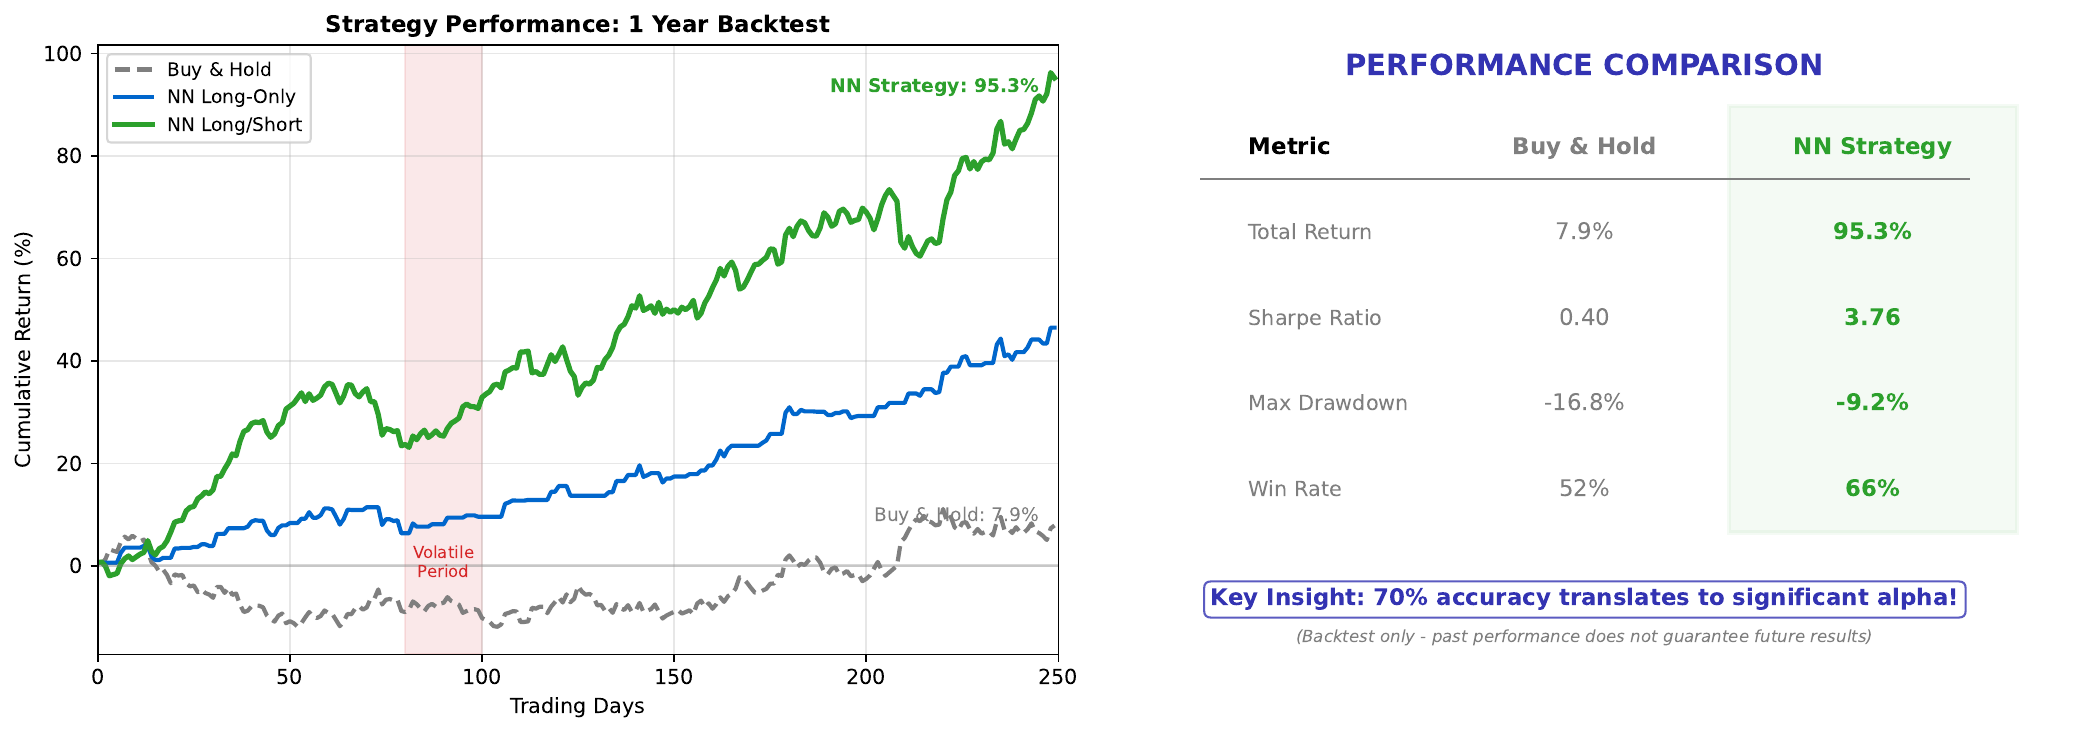
Evaluate a neural network trading strategy against a buy-and-hold benchmark.
Key Concept
A backtest simulates how a trading strategy would have performed on historical data. For neural network strategies, we compare:
- Buy-and-hold: Simply buy at start, hold throughout (benchmark)
- NN strategy: Trade based on model predictions (BUY when confidence > threshold)
The backtest reveals whether the model’s predictions translate into actual profits. A 70% accurate model doesn’t guarantee outperformance - transaction costs, timing, and magnitude of wins vs losses all matter.
Key metrics:
- Cumulative returns: Total profit over the period
- Sharpe ratio: Risk-adjusted returns
- Maximum drawdown: Largest peak-to-trough decline
The ultimate test: Does the strategy beat the benchmark after accounting for realistic trading costs?
Visual
Key Formulas
Cumulative return: \(R_{total} = \prod_{t=1}^{T} (1 + r_t) - 1\)
Sharpe ratio: \(\text{Sharpe} = \frac{\bar{r} - r_f}{\sigma_r}\)
Where:
- r-bar = mean return
- r_f = risk-free rate
- sigma_r = standard deviation of returns
Maximum drawdown: \(\text{MDD} = \max_t \left( \frac{\text{Peak}_t - \text{Value}_t}{\text{Peak}_t} \right)\)
Intuitive Explanation
Imagine two investors:
Investor A (Buy-and-hold): Buys stock on day 1 and holds for a year. No effort, no trading costs, captures all ups and downs.
Investor B (NN strategy): Uses a neural network to decide daily whether to be invested. Aims to be invested on “up” days and out on “down” days.
If Investor B has 70% accuracy:
- Captures 70% of “up” days (gains)
- Avoids 70% of “down” days (losses avoided)
But: Each trade costs money (commissions, spread). And perfect timing is impossible - predictions have some error.
The backtest answers: Does the accuracy advantage overcome the trading costs?
Practice Problems
Problem 1
Over 100 days: Buy-and-hold returns +15%. NN strategy has 60% accuracy with average daily return of +0.2% on correct UP predictions and -0.15% on incorrect predictions. Estimate NN strategy returns (ignoring costs).
Solution
**Expected daily return:** Assume 50% of days are actually UP: - 30 days: Predict UP, actually UP (60% of 50 UP days) -> +0.2% each - 20 days: Predict UP, actually DOWN (40% of 50 DOWN days) -> -0.15% each - 20 days: Predict DOWN, actually UP (40% of 50 UP days) -> 0% (not invested) - 30 days: Predict DOWN, actually DOWN (60% of 50 DOWN days) -> 0% (not invested) **Total return:** $$R = 30 \times 0.2\% + 20 \times (-0.15\%) + 0 + 0$$ $$R = 6.0\% - 3.0\% = 3.0\%$$ Wait - this is worse than buy-and-hold's 15%! **Why?** With only 60% accuracy, the strategy misses too many up days (20 missed) and still catches some down days (20 losses). The edge isn't strong enough. **Lesson:** Accuracy alone doesn't guarantee profitability.Problem 2
Transaction cost is 0.1% per trade. The NN strategy trades 200 times over the year. How much do costs reduce returns?
Solution
**Transaction cost calculation:** Total trades: 200 Cost per trade: 0.1% **Total cost:** $$\text{Costs} = 200 \times 0.1\% = 20\%$$ This is **20 percentage points** of returns lost to trading costs! **Impact:** - If strategy gross return = 25%, net return = 25% - 20% = 5% - If strategy gross return = 15%, net return = 15% - 20% = -5% (loss!) **Lesson:** High-frequency strategies need either very high accuracy or very low costs to be profitable. **Solutions:** - Trade less frequently (e.g., weekly signals) - Use lower-cost brokers - Only trade on high-confidence signals (threshold > 0.7)Problem 3
The NN strategy has maximum drawdown of 25% while buy-and-hold has 35%. Is this better? Why might an investor prefer lower drawdown?
Solution
**Yes, lower drawdown (25% vs 35%) is generally better.** **Why investors care about drawdown:** 1. **Psychological**: Watching 35% of your portfolio disappear is painful and may cause panic selling at the worst time 2. **Recovery math**: A 35% loss requires +54% gain to recover; 25% loss needs only +33% - From $100: $65 needs to grow to $100 (+54%) - From $100: $75 needs to grow to $100 (+33%) 3. **Margin calls**: Large drawdowns may trigger forced liquidation 4. **Risk management**: Institutions have drawdown limits; exceeding them means job loss 5. **Compounding**: Avoiding big losses lets compounding work in your favor **Trade-off:** Lower drawdown strategies often have lower total returns. But many investors prefer: - 12% return with 20% max drawdown over - 15% return with 40% max drawdown **Sharpe ratio** captures this: return per unit of risk.Key Takeaways
- Backtests simulate strategy performance on historical data
- Compare against buy-and-hold benchmark
- Transaction costs can eliminate prediction edge
- Accuracy doesn’t guarantee profitability
- Consider risk metrics (drawdown, Sharpe) not just returns
- Realistic backtesting includes costs, slippage, and realistic assumptions
Congratulations! You’ve completed all 20 topics in the Neural Networks course.
(c) Joerg Osterrieder 2025