19. Confusion Matrix
Download PDFConfusion Matrix
Learning Goal
Evaluate classifier performance beyond simple accuracy using precision, recall, and F1 score.
Key Concept
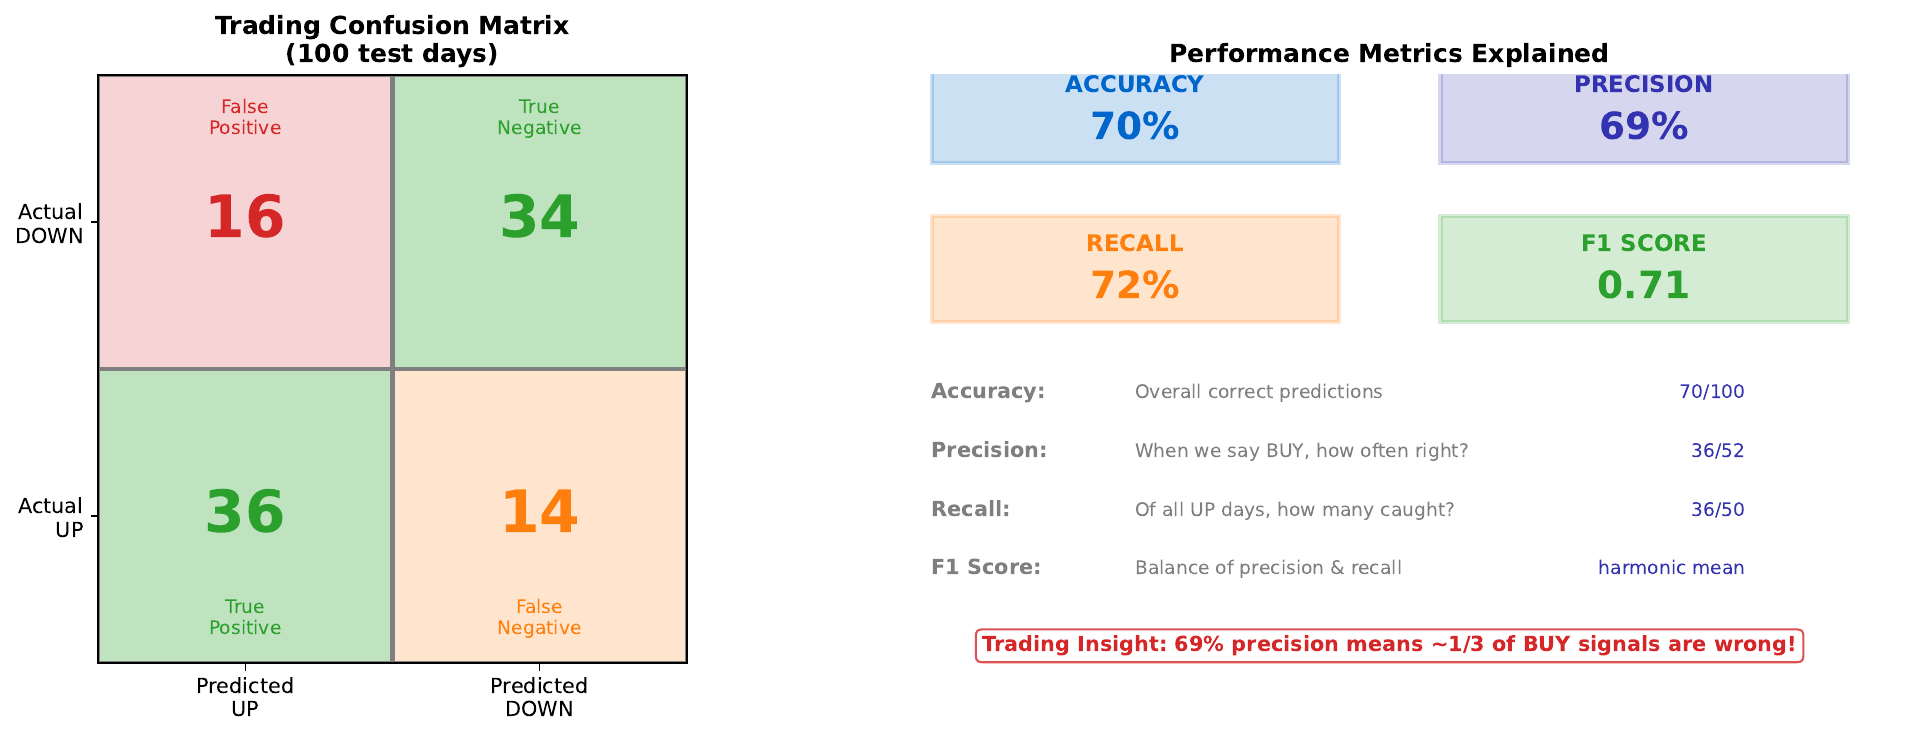
A confusion matrix breaks down predictions into four categories:
- True Positive (TP): Predicted UP, actually UP
- False Positive (FP): Predicted UP, actually DOWN (Type I error)
- True Negative (TN): Predicted DOWN, actually DOWN
- False Negative (FN): Predicted DOWN, actually UP (Type II error)
This granular view reveals important patterns that overall accuracy hides:
- Precision: When we predict UP, how often are we right?
- Recall: Of all actual UP days, how many did we catch?
- F1 Score: Harmonic mean of precision and recall
In trading, these distinctions matter: a false BUY signal (FP) costs money on a losing trade, while a missed opportunity (FN) is a foregone profit. Different strategies prioritize different metrics.
Visual
Key Formulas
Precision (positive predictive value): \(\text{Precision} = \frac{TP}{TP + FP}\)
Recall (sensitivity, true positive rate): \(\text{Recall} = \frac{TP}{TP + FN}\)
F1 Score (harmonic mean): \(F_1 = 2 \times \frac{\text{Precision} \times \text{Recall}}{\text{Precision} + \text{Recall}}\)
Accuracy: \(\text{Accuracy} = \frac{TP + TN}{TP + TN + FP + FN}\)
Intuitive Explanation
Think of a spam filter:
- High precision: When it says “spam,” it’s almost always right. Few legitimate emails are blocked.
- High recall: It catches almost all spam. Few spam emails get through.
You can’t maximize both simultaneously:
- More aggressive filtering = higher recall, lower precision
- More conservative filtering = higher precision, lower recall
In trading:
- High precision strategy: Trade rarely, but when you trade, usually win
- High recall strategy: Capture most winning opportunities, but also some losers
Practice Problems
Problem 1
Given: TP = 40, FP = 15, TN = 35, FN = 10. Calculate precision, recall, and F1 score.
Solution
**Precision:** $$\text{Precision} = \frac{TP}{TP + FP} = \frac{40}{40 + 15} = \frac{40}{55} = 0.727 = 72.7\%$$ **Recall:** $$\text{Recall} = \frac{TP}{TP + FN} = \frac{40}{40 + 10} = \frac{40}{50} = 0.800 = 80.0\%$$ **F1 Score:** $$F_1 = 2 \times \frac{0.727 \times 0.800}{0.727 + 0.800} = 2 \times \frac{0.582}{1.527} = 0.762 = 76.2\%$$ **Accuracy (for reference):** $$\text{Accuracy} = \frac{40 + 35}{40 + 15 + 35 + 10} = \frac{75}{100} = 75\%$$Problem 2
Model A: Precision = 90%, Recall = 50%. Model B: Precision = 70%, Recall = 70%. Which is better for a conservative trading strategy?
Solution
**Model A is better for conservative trading.** **Why:** **Model A (High precision):** - When it says BUY, it's right 90% of the time - Only catches 50% of opportunities - Trades less frequently but with higher confidence - Lower risk of losing trades **Model B (Balanced):** - When it says BUY, it's right 70% of the time - Catches 70% of opportunities - More trades, more wrong signals - Higher risk but also catches more winners **F1 comparison:** - Model A: F1 = 2 * (0.90 * 0.50) / (0.90 + 0.50) = 0.643 - Model B: F1 = 2 * (0.70 * 0.70) / (0.70 + 0.70) = 0.700 By F1, Model B is "better" overall. But for conservative trading that prioritizes avoiding losses, Model A's 90% precision is preferable. **Business context determines the right choice.**Problem 3
You increase the decision threshold from 0.5 to 0.8. How does this affect precision and recall?
Solution
**Higher threshold (0.8):** **Effect on predictions:** - Fewer predictions of "UP" (only high-confidence ones) - More predictions of "DOWN" (default when uncertain) **Effect on confusion matrix:** - TP decreases (fewer BUY calls, so fewer correct BUYs) - FP decreases (fewer BUY calls, so fewer wrong BUYs) - TN increases (more SELL calls, so more correct SELLs) - FN increases (more missed opportunities) **Effect on metrics:** **Precision**: Tends to **increase** $$\text{Precision} = \frac{TP \downarrow}{TP \downarrow + FP \downarrow \downarrow}$$ FP typically decreases more than TP because marginal predictions are wrong. **Recall**: **Decreases** $$\text{Recall} = \frac{TP \downarrow}{TP \downarrow + FN \uparrow}$$ Fewer correct catches, more missed opportunities. **Summary:** Higher threshold = more precise but less comprehensive.Key Takeaways
- Confusion matrix reveals four types of prediction outcomes
- Accuracy alone can be misleading (especially with imbalanced classes)
- Precision: “When I predict positive, am I right?”
- Recall: “Do I catch all the actual positives?”
- F1 balances precision and recall
- Choose metrics based on business costs of different errors
(c) Joerg Osterrieder 2025