Lecture Charts
29 static PDF charts from the Bantleon Methods lecture. Click any thumbnail to open the full PDF.
Introduction & Motivation
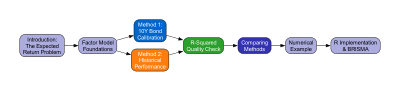
00. Lecture Roadmap
Overview of topics and structure
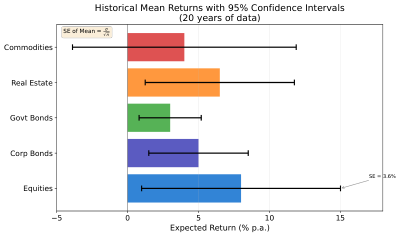
01. Return Estimation Error
Sample mean vs true mean uncertainty
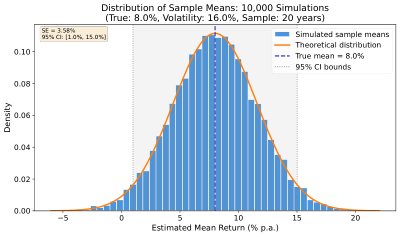
01b. Estimation Error Simulation
Monte Carlo demonstration
01c. Methods Comparison
M1 vs M2 vs Hybrid overview
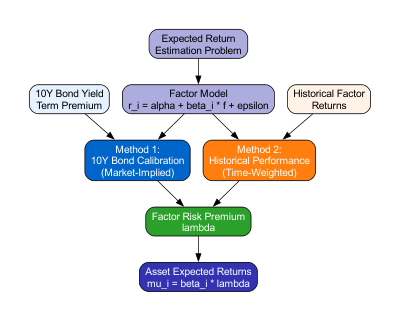
Factor Model
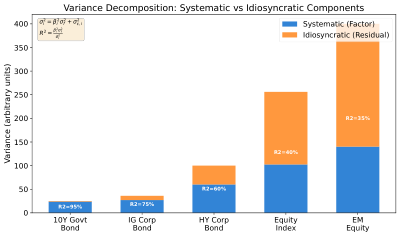
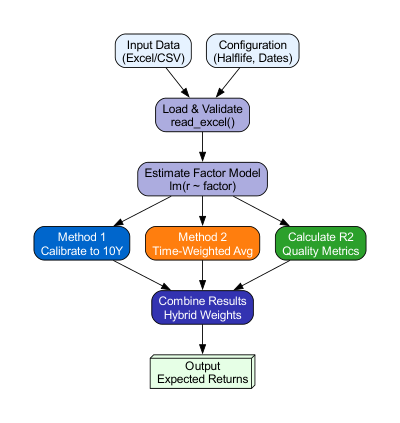
02. Factor Decomposition
r = B*f + epsilon breakdown
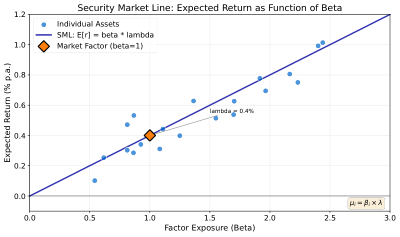
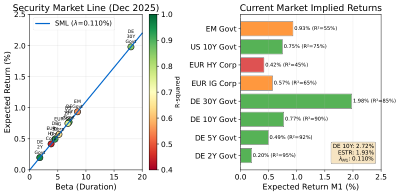
02b. Beta-Lambda Scatter
Asset betas vs implied returns
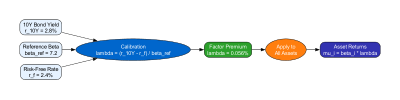
02c. Calibration Concept
How lambda is calibrated
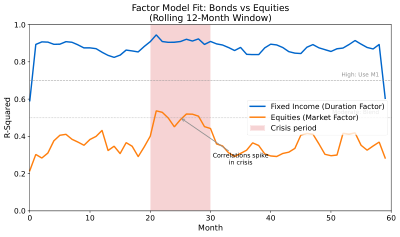
02d. Rolling R-Squared by Asset
Time-varying explanatory power
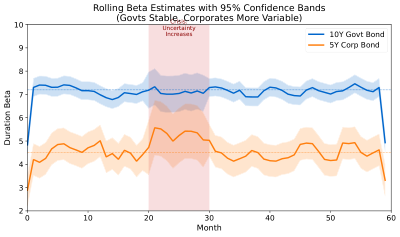
02e. Beta Stability Bands
Factor loading stability over time
Calibration Methods
Two complementary approaches for estimating implied risk premia: market-based (M1) using yield curve data, and historical (M2) using weighted factor returns.
Method 1: Market-Based
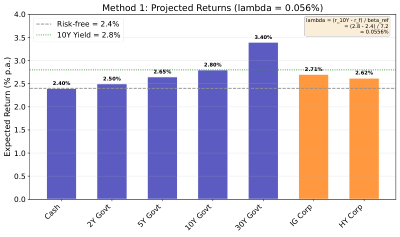
03. Method 1 Projection
Bond yield spread calibration
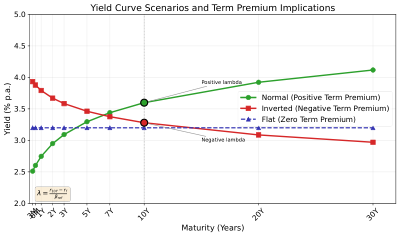
03b. Inverted Yield Curve
Special case handling
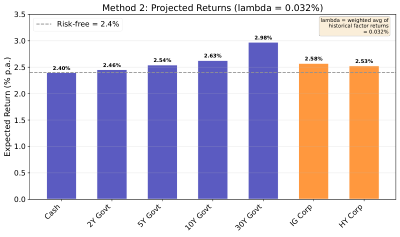
Method 2: Historical
Regime Detection
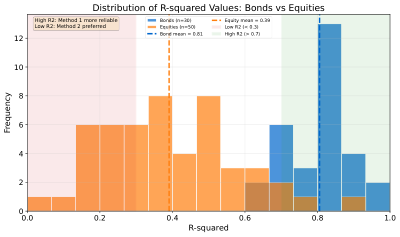
05. R-Squared Distribution
Historical R-squared values
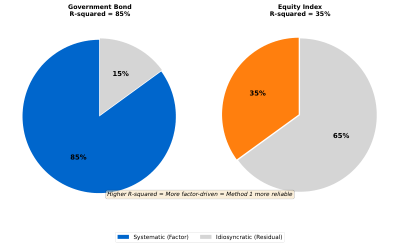
05b. Bond vs Equity R-Squared
Asset class comparison
Method Comparison
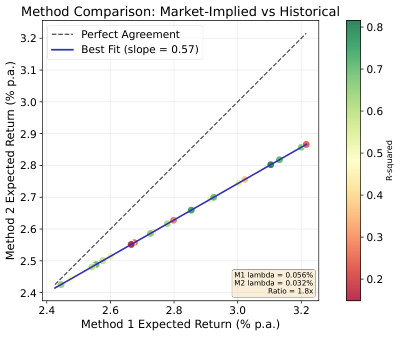
06. Method Comparison Scatter
M1 vs M2 implied returns
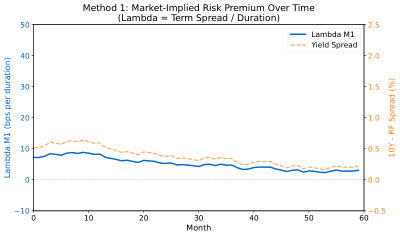
06b. Lambda M1 Time Series
Market-based lambda over time
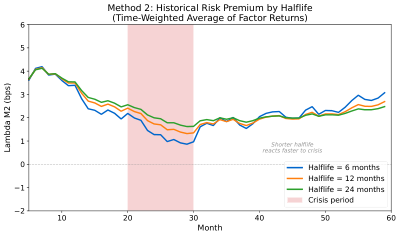
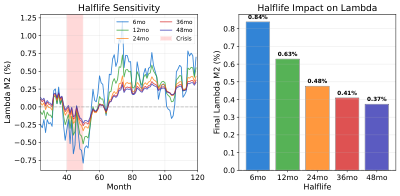
06c. Lambda M2 Time Series
Historical lambda over time
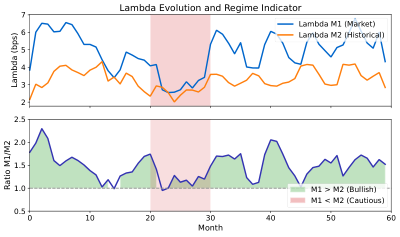
06d. Lambda Ratio Regime
M1/M2 ratio as regime indicator
Results & Validation
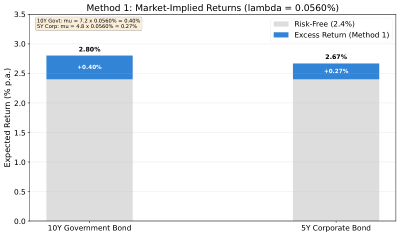
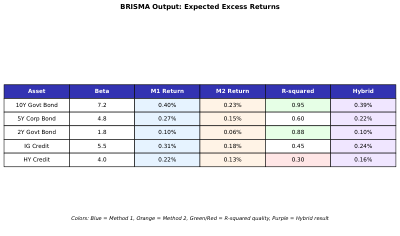
07. Method 1 Results
M1 implied returns output
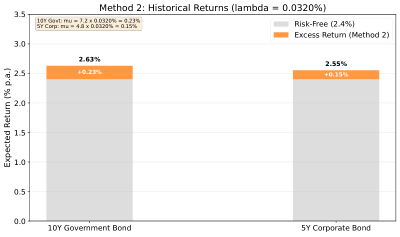
07b. Method 2 Results
M2 implied returns output
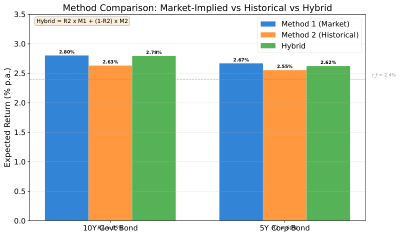
07c. Final Comparison
Side-by-side method results
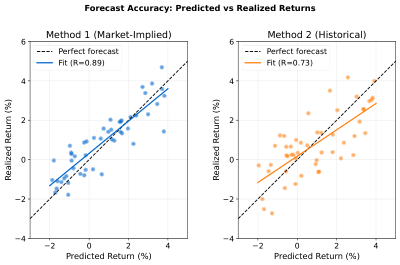
07d. Predicted vs Realized
Forecast accuracy scatter
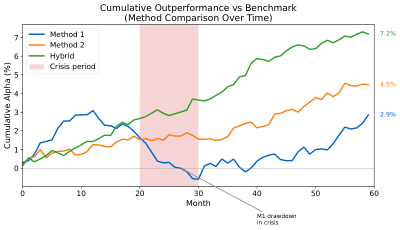
07e. Cumulative Outperformance
Strategy performance over time
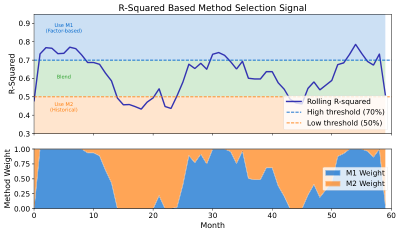
07f. Regime Switch Signals
M1/M2 switch timing