A2: Gresham's Law — When Bad Money Wins
Introduction
"Bad money drives out good money" — this famous economic principle, known as Gresham's Law, explains why people spend depreciating currency and hoard stable currency. You'll explore an agent-based model that simulates this tipping-point behavior.
The Model
Imagine 1,000 agents (simulated people) who each period must decide: spend Currency A (the "bad money" that loses 5% of its value per period) or spend Currency B (the "good money" that only loses 1% per period)?
The model uses a logit feedback rule to determine the probability that an agent spends Currency A:
P(spend A) = 1 / (1 + exp(-z_t))where:
z_t = k_feedback × (share_A_{t-1} - 0.5) + (r_A - r_B) × 10 + base_bias × (t / T)- Logit feedback: A mathematical formula that converts any number
zinto a probability between 0 and 1. Whenzis large positive, P ≈ 1 (almost certain). Whenzis large negative, P ≈ 0 (almost never). - k_feedback (default: 15.0): How strongly past behavior amplifies current behavior. If many people spent A yesterday, that makes it more rational for you to spend A today (because holding onto A means you'll suffer the depreciation loss).
- (r_A - r_B) × 10: The depreciation differential bias. When Currency A depreciates faster than B, agents have an incentive to spend A and hoard B. With default values (r_A=0.05, r_B=0.01), this contributes +0.4 to the logit at every step. With equal depreciation (r_A=r_B), this term is zero.
- base_bias (default: 0.10): A small exogenous drift toward spending A, scaled by time progress.
- share_A_{t-1}: The fraction of agents who spent A in the previous period.
- t / T: Time progress (0 at start, 1 at end), which gradually increases the pressure to spend A.
This creates a tipping point: initially, agents are split 50-50, but once enough people start spending A, the feedback loop kicks in and everyone switches to spending A (and hoarding B).
Your Task
Run the simulation with three parameter variations and analyze what changes:
Variation 1: Weak Feedback (k_feedback = 5.0)
Change: Reduce k_feedback from 15.0 to 5.0.
Question: Does tipping still happen within 100 periods? If not, what happens instead? How does the rate of change in circulation shares compare to the baseline?
Variation 2: Strong Feedback (k_feedback = 25.0)
Change: Increase k_feedback from 15.0 to 25.0.
Question: What happens to the tipping point timing? How fast is the transition from 50-50 to A-dominance?
Variation 3: Equal Depreciation (r_A = r_B = 0.03)
Change: Set both depreciation rates equal: r_A = 0.03 and r_B = 0.03.
Question: Does tipping still occur? Why or why not? What does this tell you about the conditions required for Gresham's Law?
Open Extension (Optional)
Add a third currency C with r_C = 0.00 (perfectly stable, like gold-backed currency).
Question: Does C get hoarded even more than B? Does A still drive out both B and C, or does C survive in circulation?
How to Run
- Download the source code:
L02_Monetary_Economics/05_greshams_law_simulation/chart.py - Open Google Colab: colab.research.google.com
- Upload the file, or copy-paste the code into a new notebook.
- Modify parameters for each variation:
# For Variation 1 (weak feedback): k_feedback = 5.0 # For Variation 2 (strong feedback): k_feedback = 25.0 # For Variation 3 (equal depreciation): r_A = 0.03 r_B = 0.03 - Run the code (Shift+Enter or click Run). The chart will display inline.
- Save each chart (right-click → Save Image).
Deliverables
Prepare a 7-slide presentation (PowerPoint, Google Slides, or PDF):
- Title slide: Your name, course, "Gresham's Law Simulation"
- The Model: Explain the logit feedback rule and what each parameter means.
- Baseline Results: Show the original chart (k=15). When does tipping occur?
- Variation 1: Show weak feedback chart (k=5). What changed?
- Variation 2: Show strong feedback chart (k=25). What changed?
- Variation 3: Show equal depreciation chart (r_A=r_B=0.03). What changed?
- Key Insight: In 1-2 sentences, explain what controls WHETHER tipping happens vs HOW FAST it happens.
Time Allocation
- Reading & Setup: 10 minutes
- Running Variations: 20 minutes
- Analysis: 15 minutes
- Slides: 10 minutes
- Total: 45 minutes + 10 minutes presentation
Assessment Criteria
| Criterion | Weight |
|---|---|
| Correct implementation of variations | 30% |
| Accurate description of tipping behavior | 30% |
| Clear charts with appropriate labels | 20% |
| Insightful explanation of k vs depreciation difference | 20% |
Reference
Selgin, G. (1996). Salvaging Gresham's Law: The Good, the Bad, and the Illegal. Journal of Money, Credit and Banking, 28(4), 637-649.
Model Answer Presentation (7 Slides)
Slide 3
Baseline: k = 15, Tipping at ~Period 48
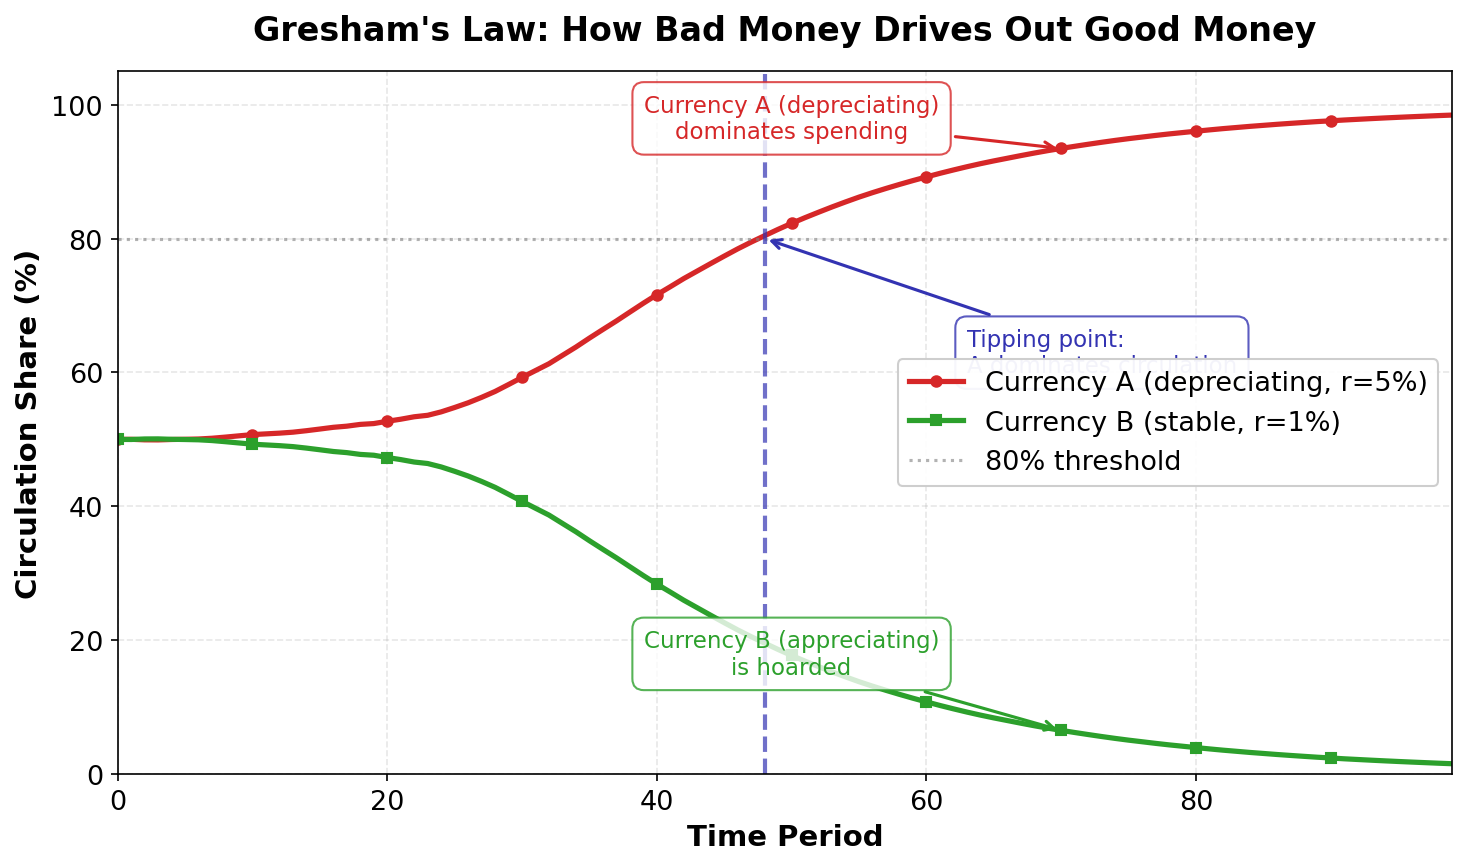
Observations:
- Initially 50-50 split between spending A and B
- Tipping point at period ~48: Currency A reaches 80% circulation
- By period 100: A dominates spending (~98.5%), B is hoarded
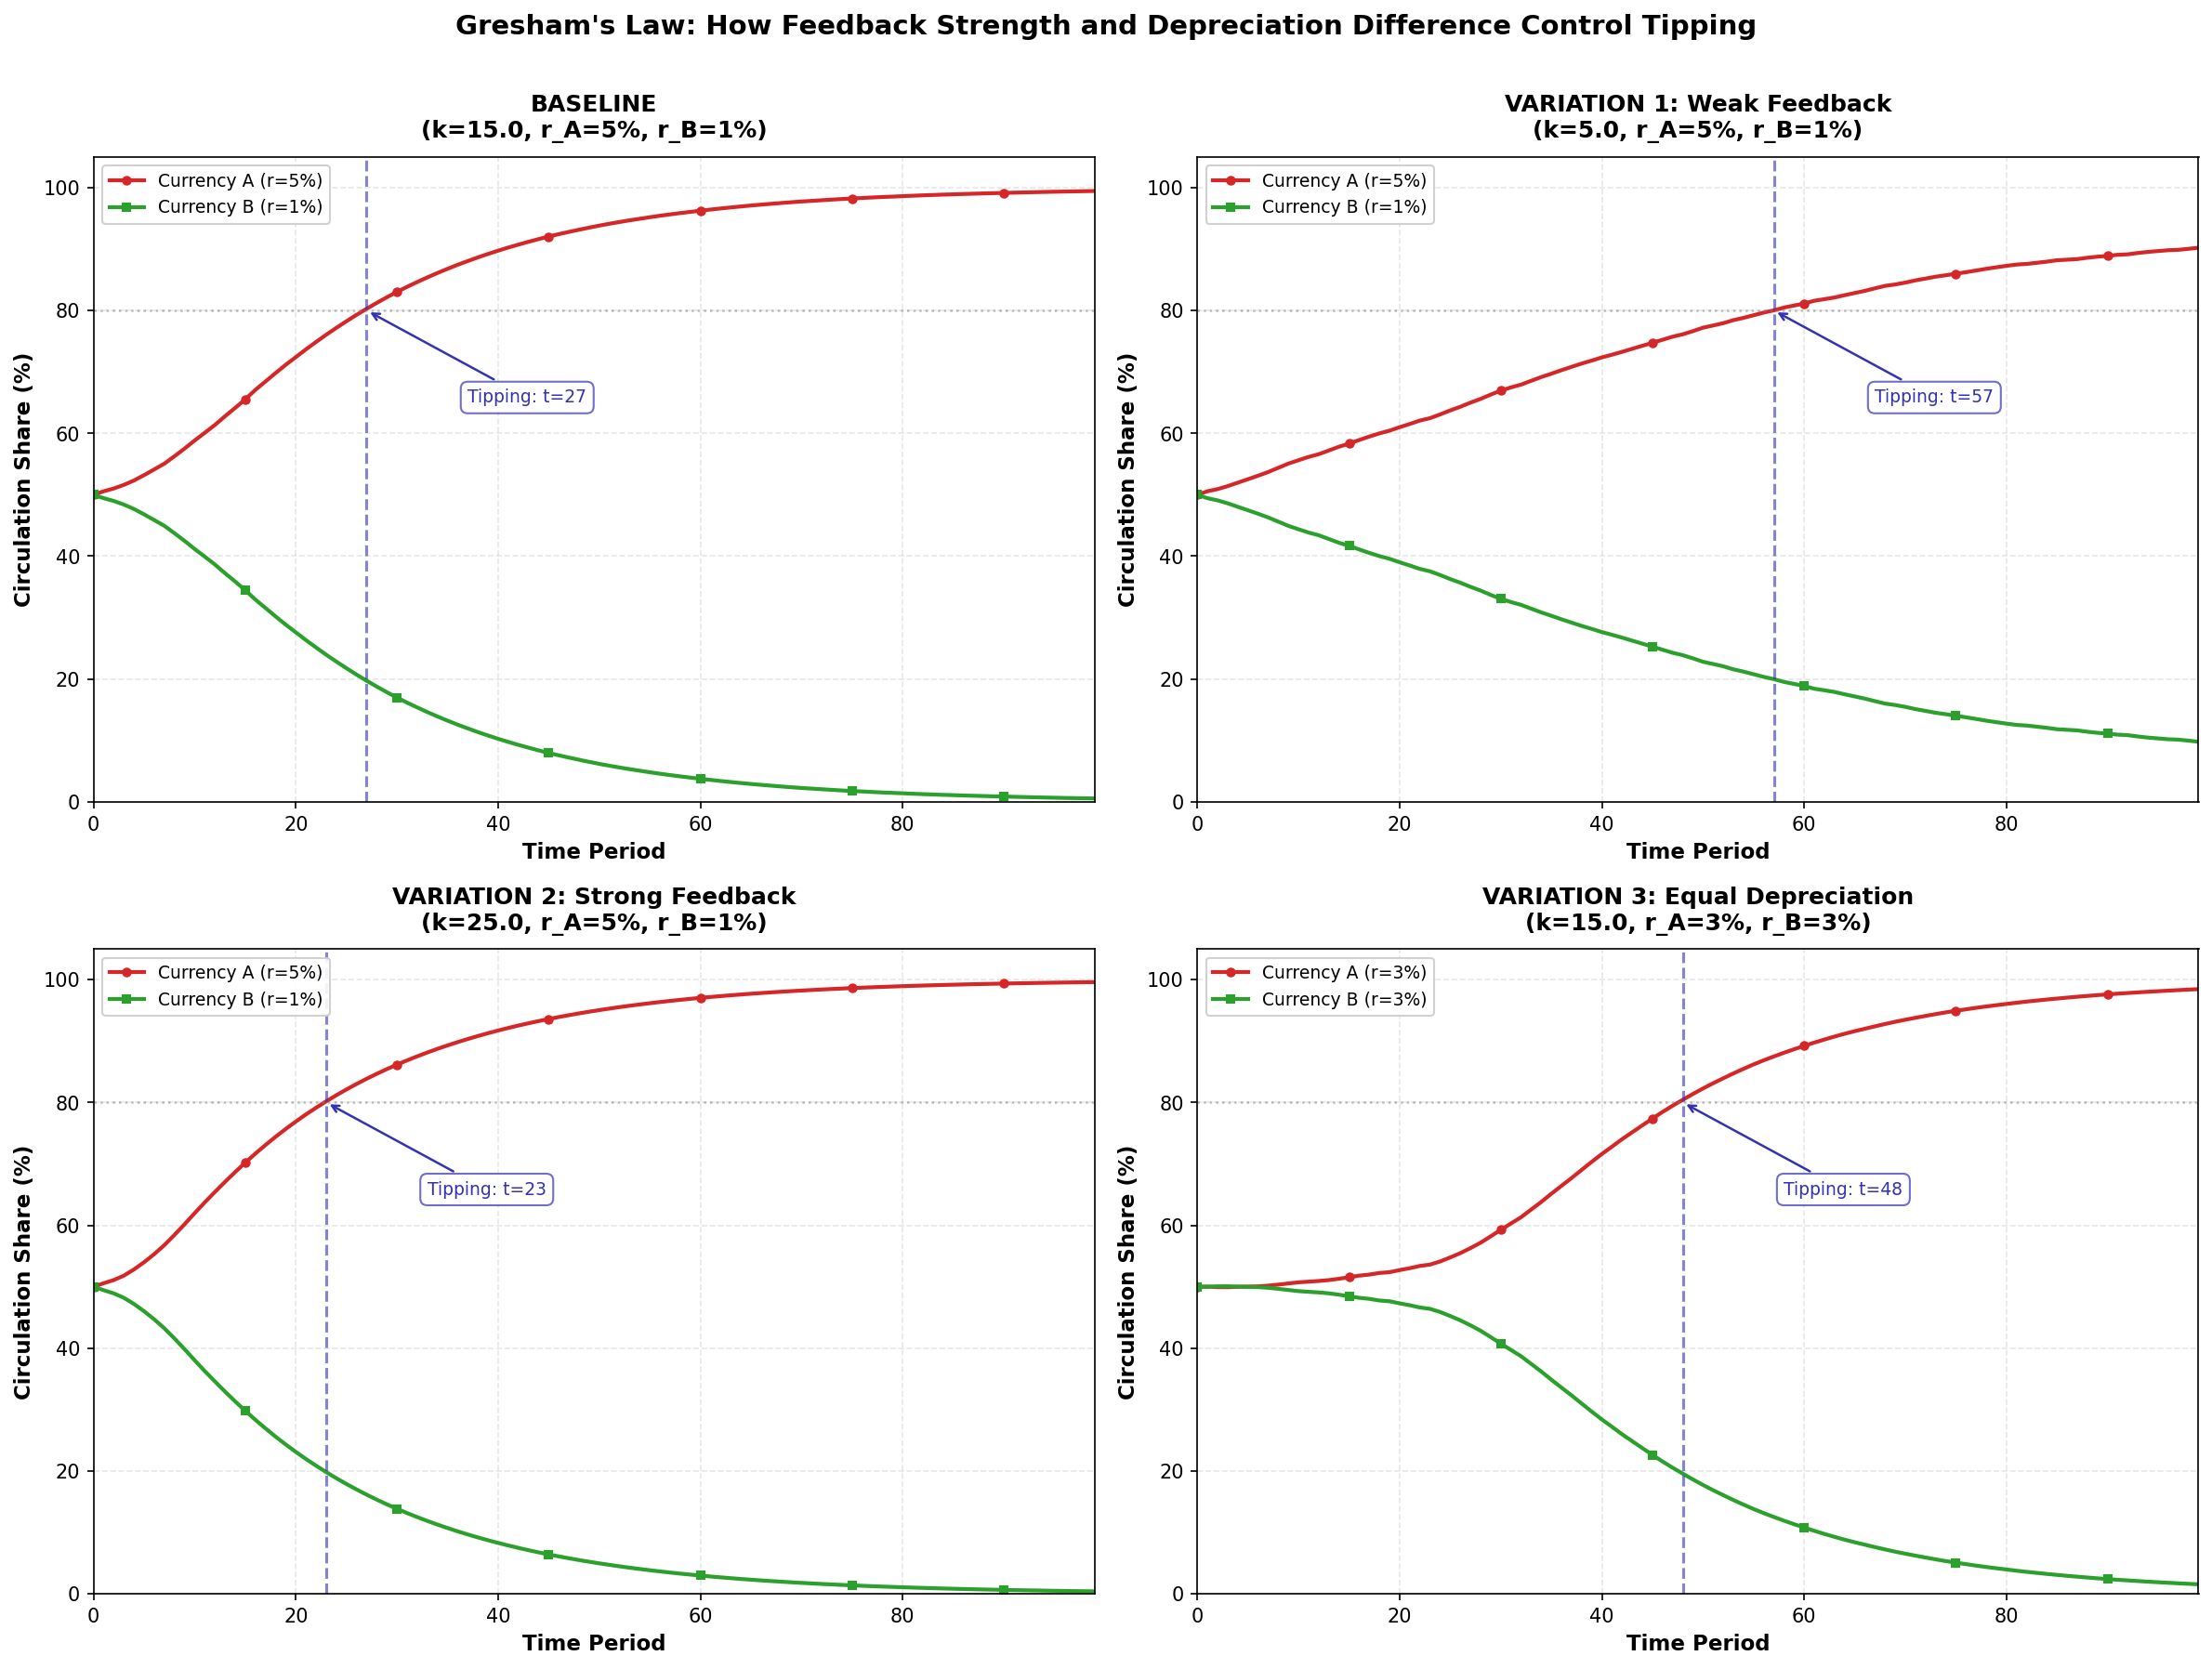
Note: The varied chart (next slides) uses an explicit depreciation differential term (r_A - r_B) x 10 in the logit, which accelerates baseline tipping to t=27.
Slide 4
Variation 1: Weak Feedback (k = 5)
Panel 2 (Top Right): Weak feedback delays tipping significantly -- tipping occurs at t=57 (vs t=27 baseline). Currency A reaches ~90% by period 100.
Why? Lower k means past behavior has less influence. The depreciation differential (4 pp) and small exogenous drift still push toward spending A, but the feedback loop is too weak to create a rapid cascade. The transition from 50-50 to A-dominance takes more than twice as long as baseline.
Key Insight: Weak feedback = delayed tipping. Even with the same depreciation difference, insufficient feedback strength stretches the transition over many more periods.
Slide 5
Variation 2: Strong Feedback (k = 25)
Panel 3 (Bottom Left): Strong feedback accelerates tipping to ~period 23.
Why? Higher k means past behavior strongly amplifies current behavior. Combined with the depreciation differential of 0.4 pushing the logit positive, even a small deviation from 50-50 triggers a rapid cascade. The transition from 50-50 to A-dominance happens in roughly 10 periods.
Key Insight: Strong feedback = faster tipping, earlier tipping point. The S-curve transition is sharper. Tipping at t=23 vs baseline t=27 shows diminishing returns from increasing k when the depreciation differential already provides a strong push.
Slide 6
Variation 3: Equal Depreciation (r_A = r_B = 3%)
Panel 4 (Bottom Right): Tipping is significantly delayed to ~period 48 (vs baseline t=27). The depreciation differential is zero, so only the small exogenous drift (base_bias) gradually pushes spending toward A.
Why? With equal depreciation (r_A = r_B = 3%), the depreciation_bias term is zero. There is no quality difference to drive Gresham's Law. The only remaining force is the small base_bias drift (0.10 * t/T), which slowly nudges the logit positive over time. This eventually triggers the feedback loop, but the transition takes nearly twice as long as baseline.
Key Insight: Removing the depreciation differential delays tipping by ~21 periods (from t=27 to t=48). The depreciation difference is the primary accelerant of Gresham's Law — without it, the feedback loop lacks an initial push and must rely on weak exogenous drift to eventually trigger.