A1: How Fast Do Payment Technologies Spread?
Introduction
New payment technologies don't take over the world overnight. They follow a predictable pattern called an S-curve (a curve shaped like the letter S that shows how technology adoption starts slow, accelerates, then levels off). The Rogers (1962) Diffusion of Innovations model describes this using three key parameters: the carrying capacity K (the maximum percentage of people who will ever adopt the technology), the growth rate r (how fast adoption accelerates during the steep middle phase), and the inflection point t0 (the year when adoption reaches half of its maximum level K). Understanding these parameters helps predict whether a payment technology will become mainstream or remain niche.
Your Task
Your job is to replicate the chart showing adoption S-curves for six payment technologies (credit cards, ATMs/debit, online banking, mobile payments, cryptocurrencies, and CBDCs). Then explore how changes to the model parameters affect adoption trajectories.
Required Variations:
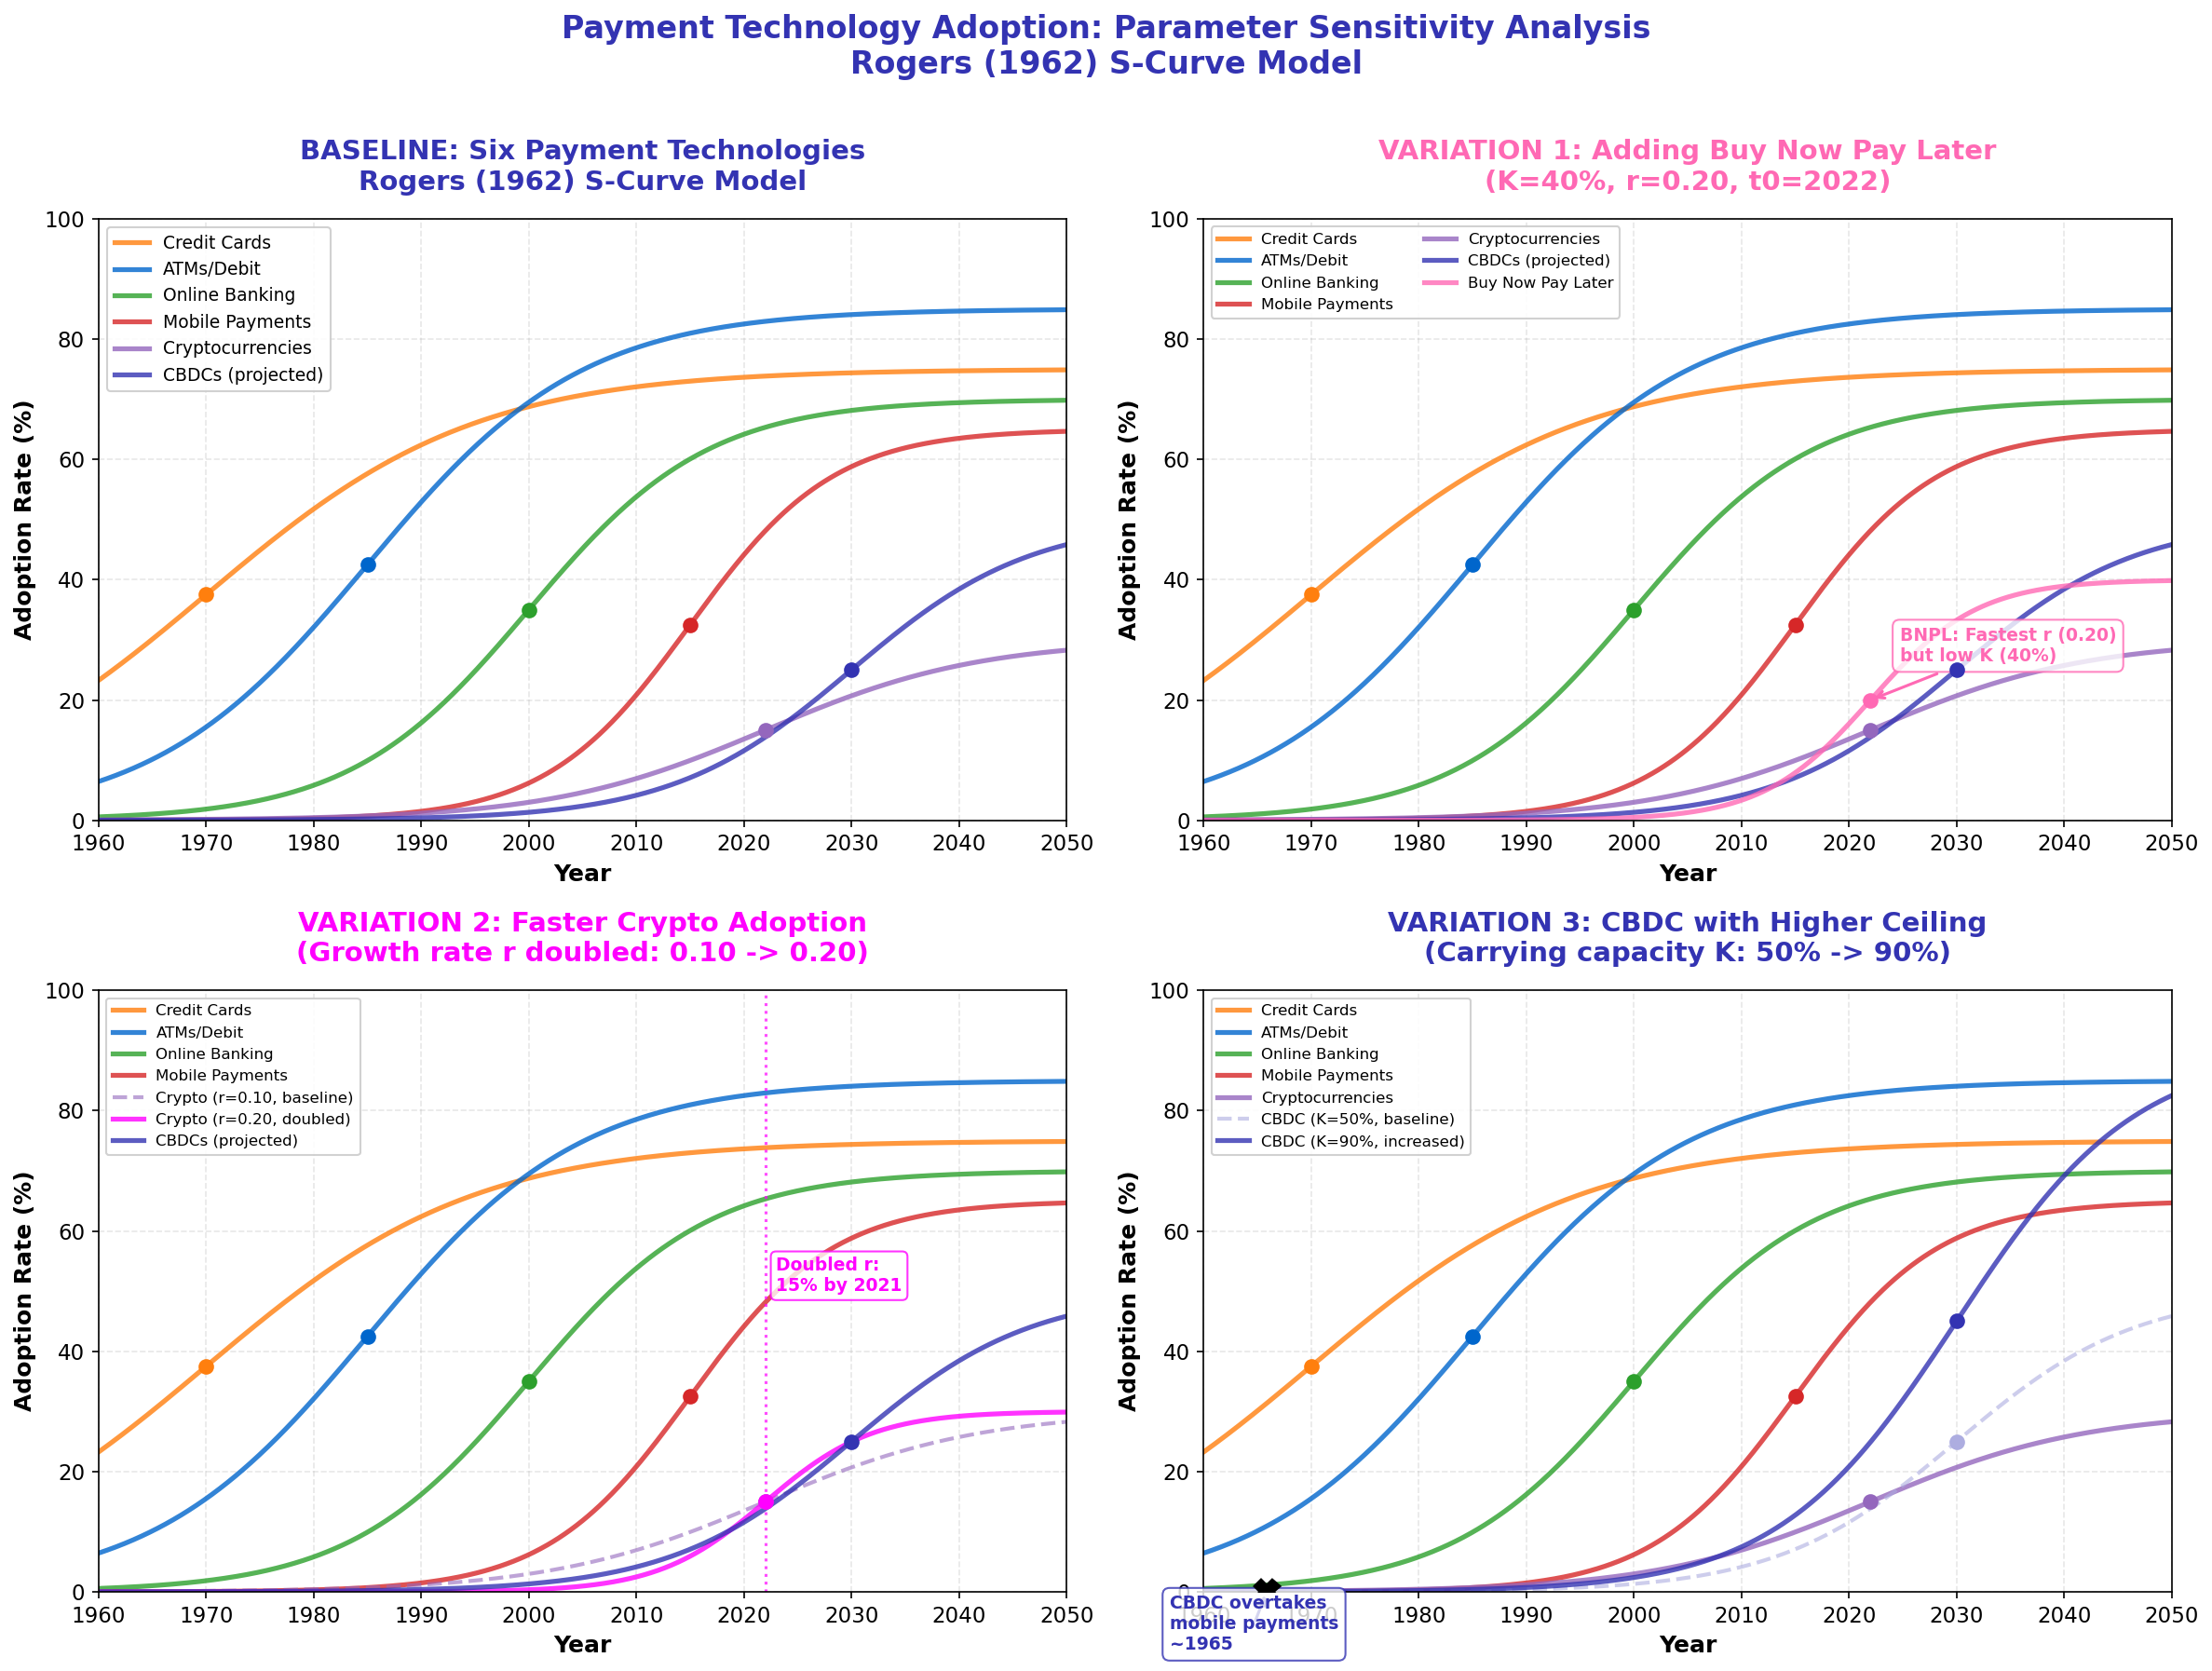
- Add a new technology: Add "Buy Now Pay Later" (BNPL) services with K=40%, r=0.20, t0=2022. How does its adoption curve compare to existing technologies? Why might BNPL have a higher growth rate r but lower ceiling K than credit cards?
- Double the growth rate for crypto: Change the cryptocurrency growth rate r from 0.10 to 0.20. What year does adoption reach 50% of its ceiling (which is 15% of the population)? Compare this to the original model.
- Increase CBDC ceiling: Set the CBDC (Central Bank Digital Currency) carrying capacity K to 90% instead of 50%. How does the curve change by 2050? Would a government-backed digital currency with K=90% eventually overtake mobile payments?
Open Extension (optional, for extra credit):
The S-curve (logistic function) is not the only growth model. Compare it with the Gompertz curve: G(t) = K * exp(-exp(-r*(t-t0))). The Gompertz curve has a slower initial growth phase but faster late-stage growth. Which model fits better for technologies with rapid early adoption (like mobile payments) versus slow-burn technologies (like credit cards)?
How to Run
- Open Google Colab (colab.research.google.com)
- Create a new notebook
- Paste the Python code from
chart_varied.py - Click the Run button (play icon) on each cell
- Download the generated charts
- Use the charts in your presentation
Time Budget
- 45 minutes: Code exploration + chart generation + analysis
- 10 minutes: Presentation (5-7 slides)
Deliverable
A 5-7 slide presentation that includes:
- The S-curve model equation and parameter definitions
- Your replicated baseline chart (6 technologies)
- At least one variation chart you generated
- Analysis: Which parameters matter most for predicting technology success?
- One insight: What surprised you or challenged your assumptions?
Presentation Tips:
- Use plain-text math (S = K / (1 + exp(-r*(t-t0)))) not LaTeX
- Define every term when first used
- Show charts full-screen (not embedded in slides with tiny text)
- Compare curves visually (don't just list numbers)
- End with a testable prediction: "By 2030, I predict [technology X] will reach [Y]% adoption because..."
Assessment Criteria:
- Correct replication of baseline chart (20%)
- All three required variations completed (30%)
- Clear explanation of how parameter changes affect curves (30%)
- Presentation clarity and visual design (20%)
Model Answer Presentation (7 Slides)
Slide 3
Baseline: Six Payment Technologies
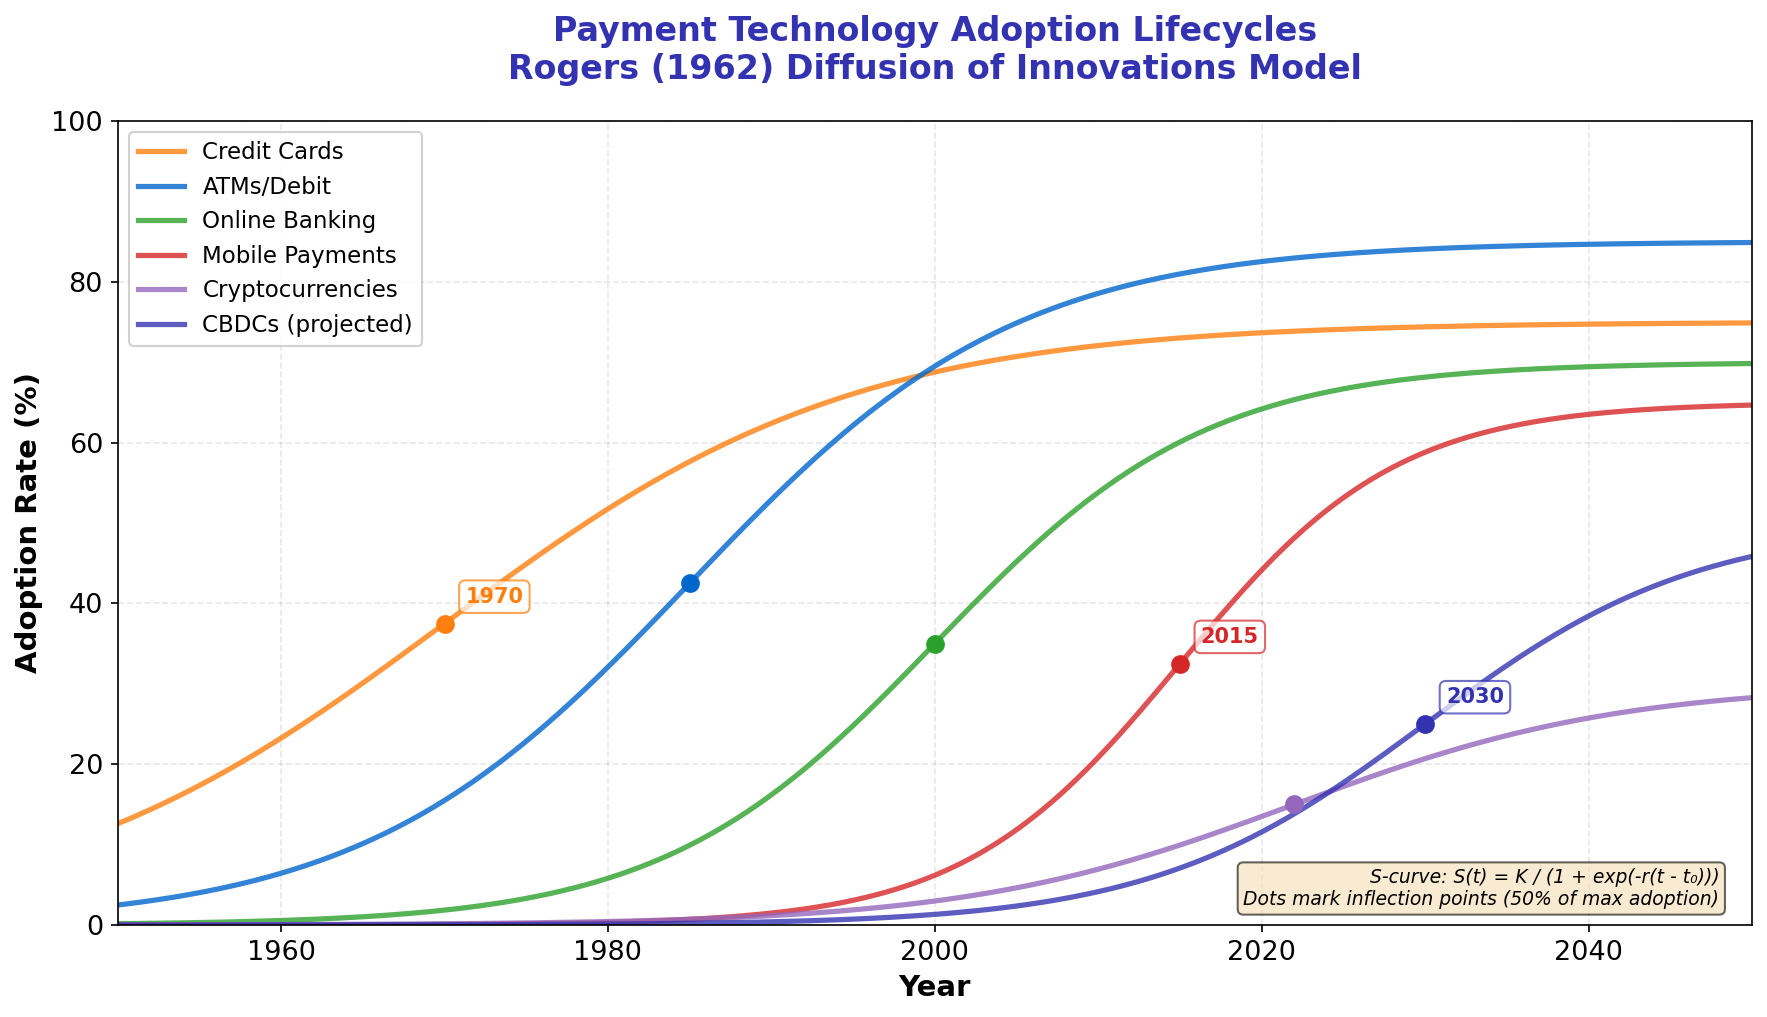
Key Observations:
- Credit cards: slowest growth (r=0.08) but highest ceiling (K=75%)
- Mobile payments: fastest growth (r=0.15) but medium ceiling (K=65%)
- Cryptocurrencies: slow growth (r=0.10) and low ceiling (K=30%)
- Growth rate r determines steepness through inflection, carrying capacity K determines finish line
Slide 4
Variation 1: Adding Buy Now Pay Later (BNPL)
Parameters: K=40%, r=0.20, t0=2022
Analysis:
- BNPL has the fastest growth rate (r=0.20) of all technologies shown
- But lowest ceiling among traditional payments (K=40%)
- Interpretation: BNPL spreads quickly among young consumers (high r) but faces regulatory limits and consumer skepticism that cap long-term adoption (low K)
- By 2035, BNPL reaches ~38% (near its ceiling), while credit cards continue growing toward 75%