Payments are the largest fintech vertical by transaction volume and revenue. In L02 we explored how behavioral economics and choice architecture shape financial product adoption. Now we turn to the infrastructure that underpins every financial transaction: the payment system itself. Every payment interface — from a contactless tap to a cross-border wire — is a designed experience that shapes user behavior, merchant economics, and financial inclusion.
- Identify the key stages of payment evolution from barter to central bank digital currencies. [Understand]
- Explain the four-party card payment model and how value flows through the network. [Understand]
- Analyze the merchant cost structure and the economics of interchange fees. [Analyze]
- Compare real-time payment systems (UPI, PIX, FedNow) and their design trade-offs. [Analyze]
- Evaluate the design choices underlying CBDCs, stablecoins, and the future of programmable money. [Evaluate]
Bloom's levels covered: Understand, Analyze, Evaluate
Overview
Frames 1–3 · Opening, Learning Objectives, Bridge from L02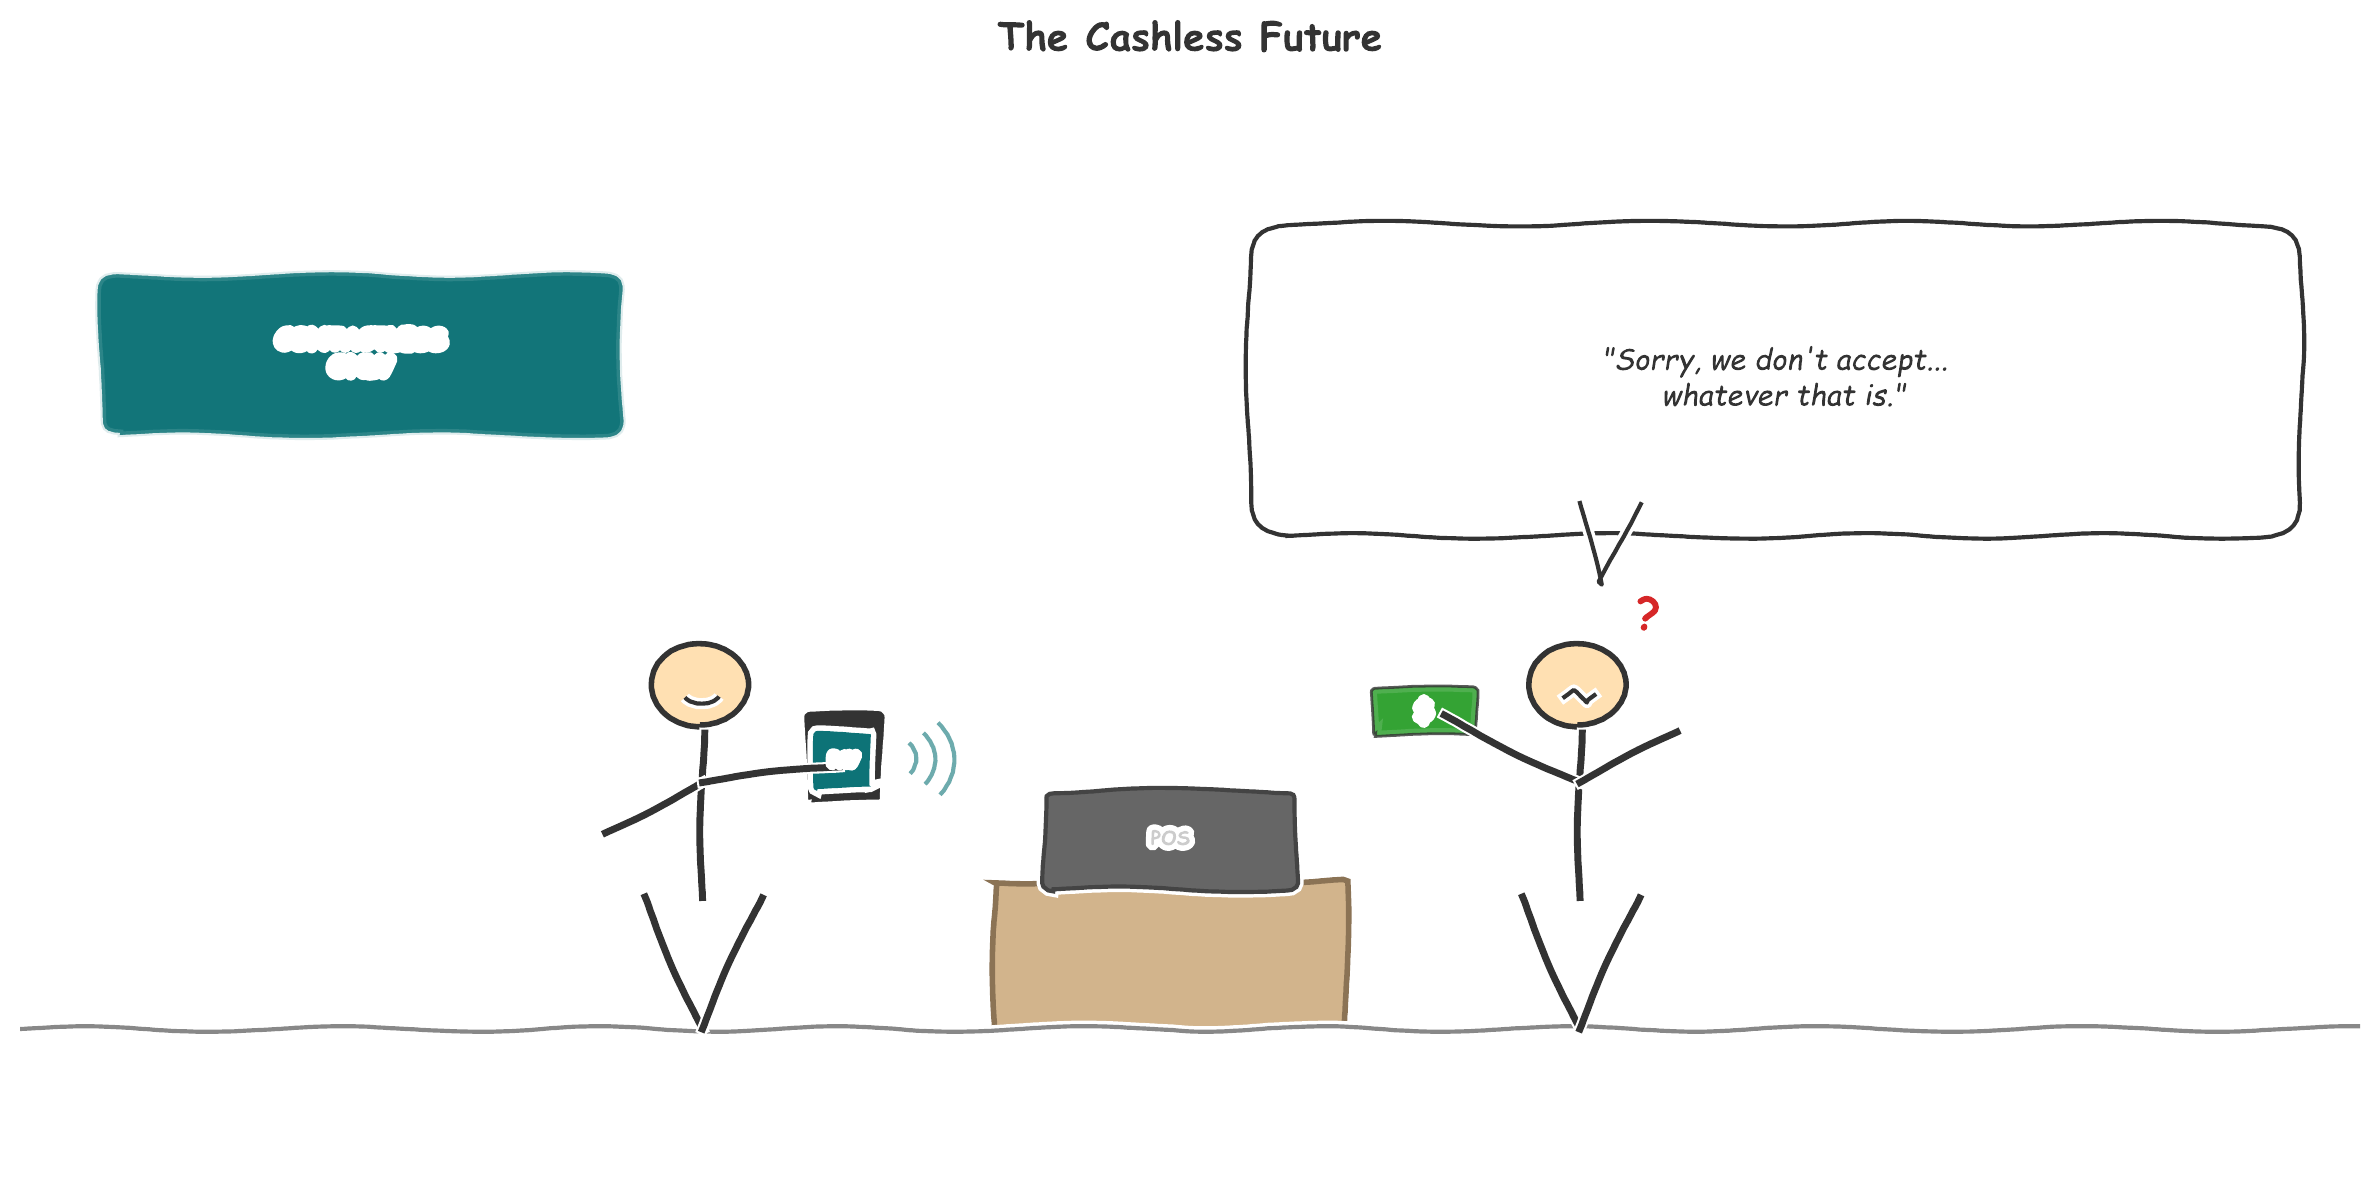
In Lecture 2 we examined the demand side of fintech — trust, adoption dynamics, nudging, and choice architecture. Now we shift to the plumbing: the payment rails that move trillions of dollars every day. Payments sit at the intersection of technology, regulation, and behavioral design. They are simultaneously the oldest financial activity (barter) and the most rapidly innovating one (programmable money).
Payments represent the largest fintech vertical globally. In 2023, global digital payment transaction value exceeded USD 9.5 trillion. Behind every transaction lies a complex chain of authorization, clearing, and settlement — a chain that fintech is fundamentally rewiring.
"Payments are not just a feature of finance — they are the foundation. Every other financial product, from lending to insurance, depends on the ability to move money reliably."
Payment Evolution
Frames 4–8 · History, Timeline, Key TransitionsFrom Barter to Programmable Money
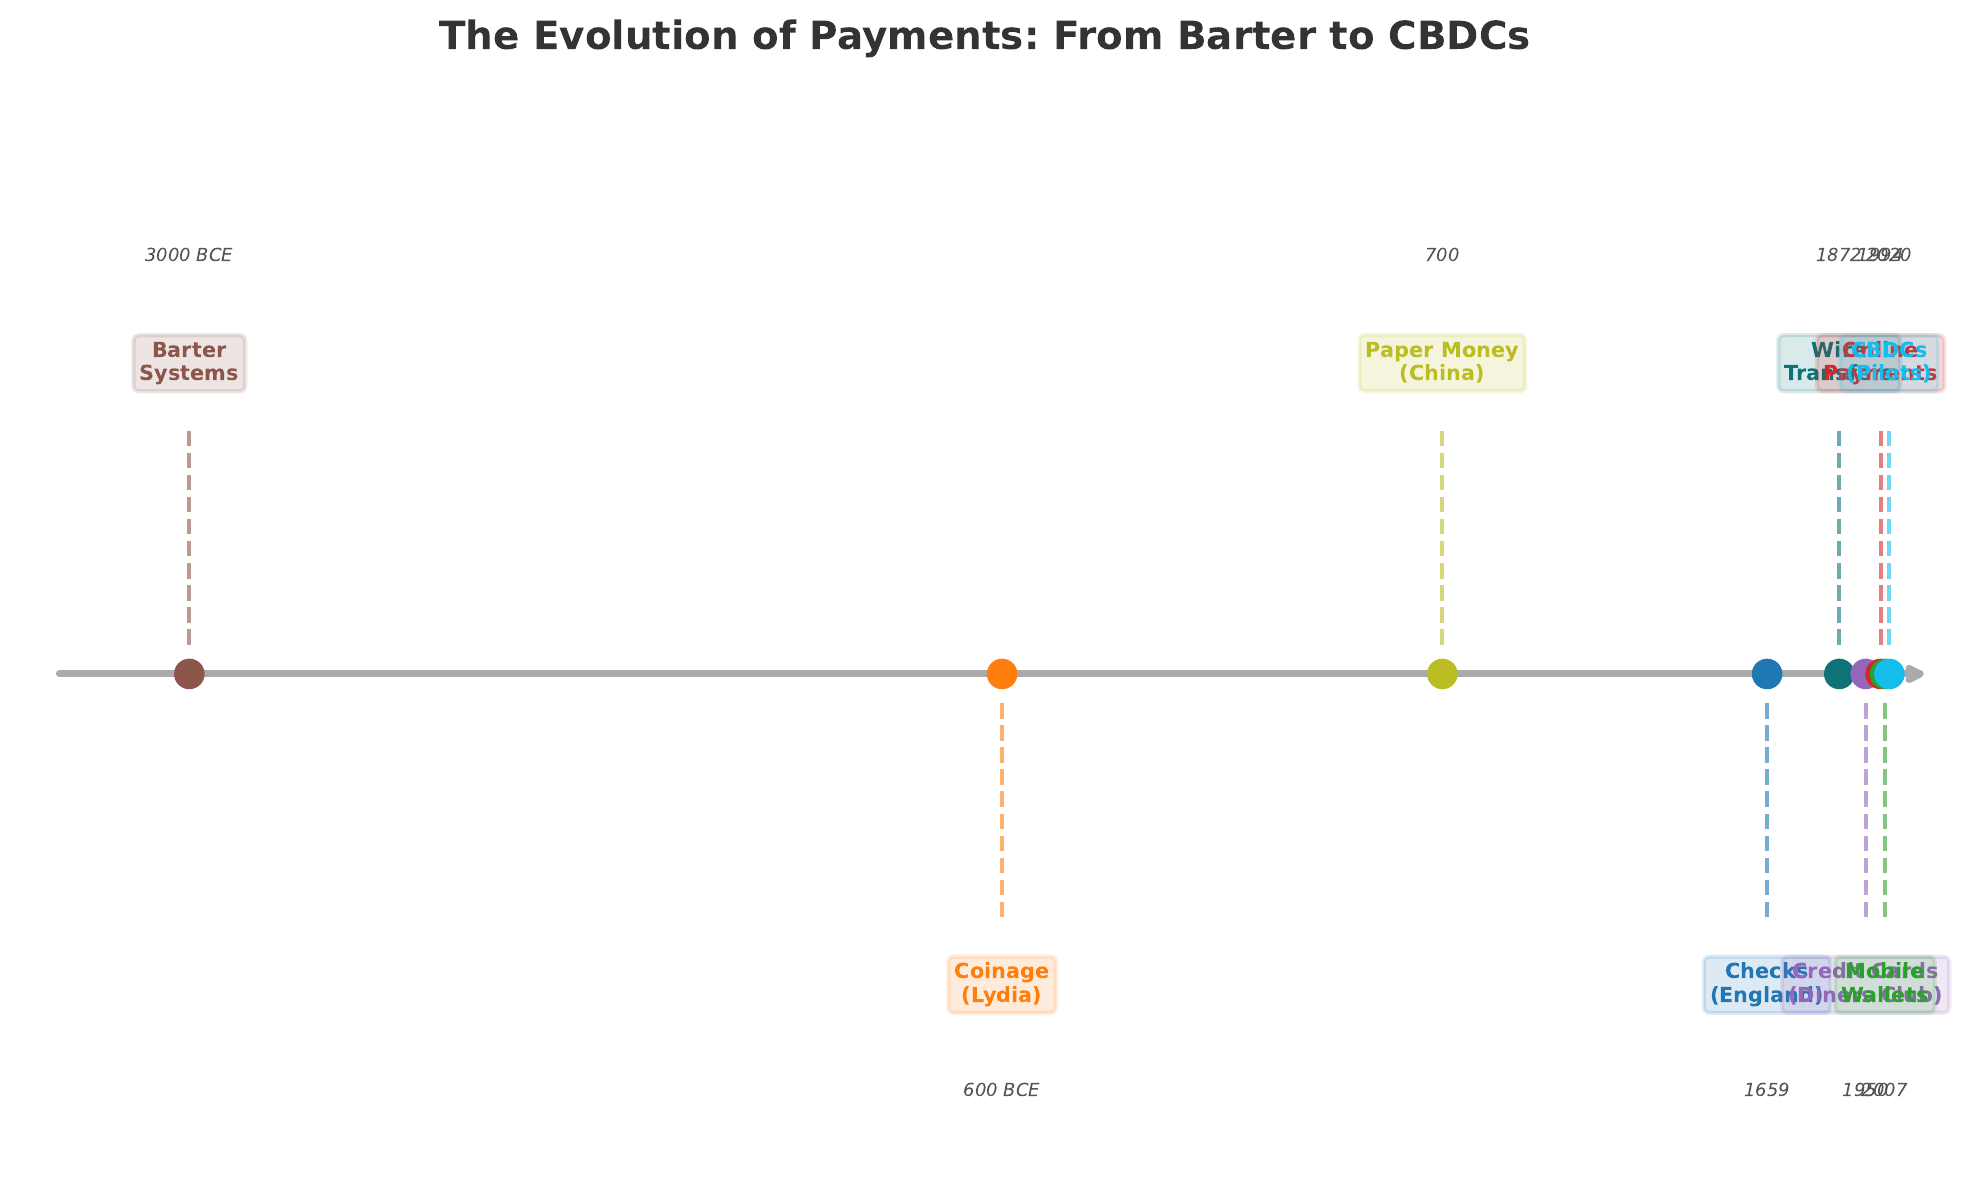
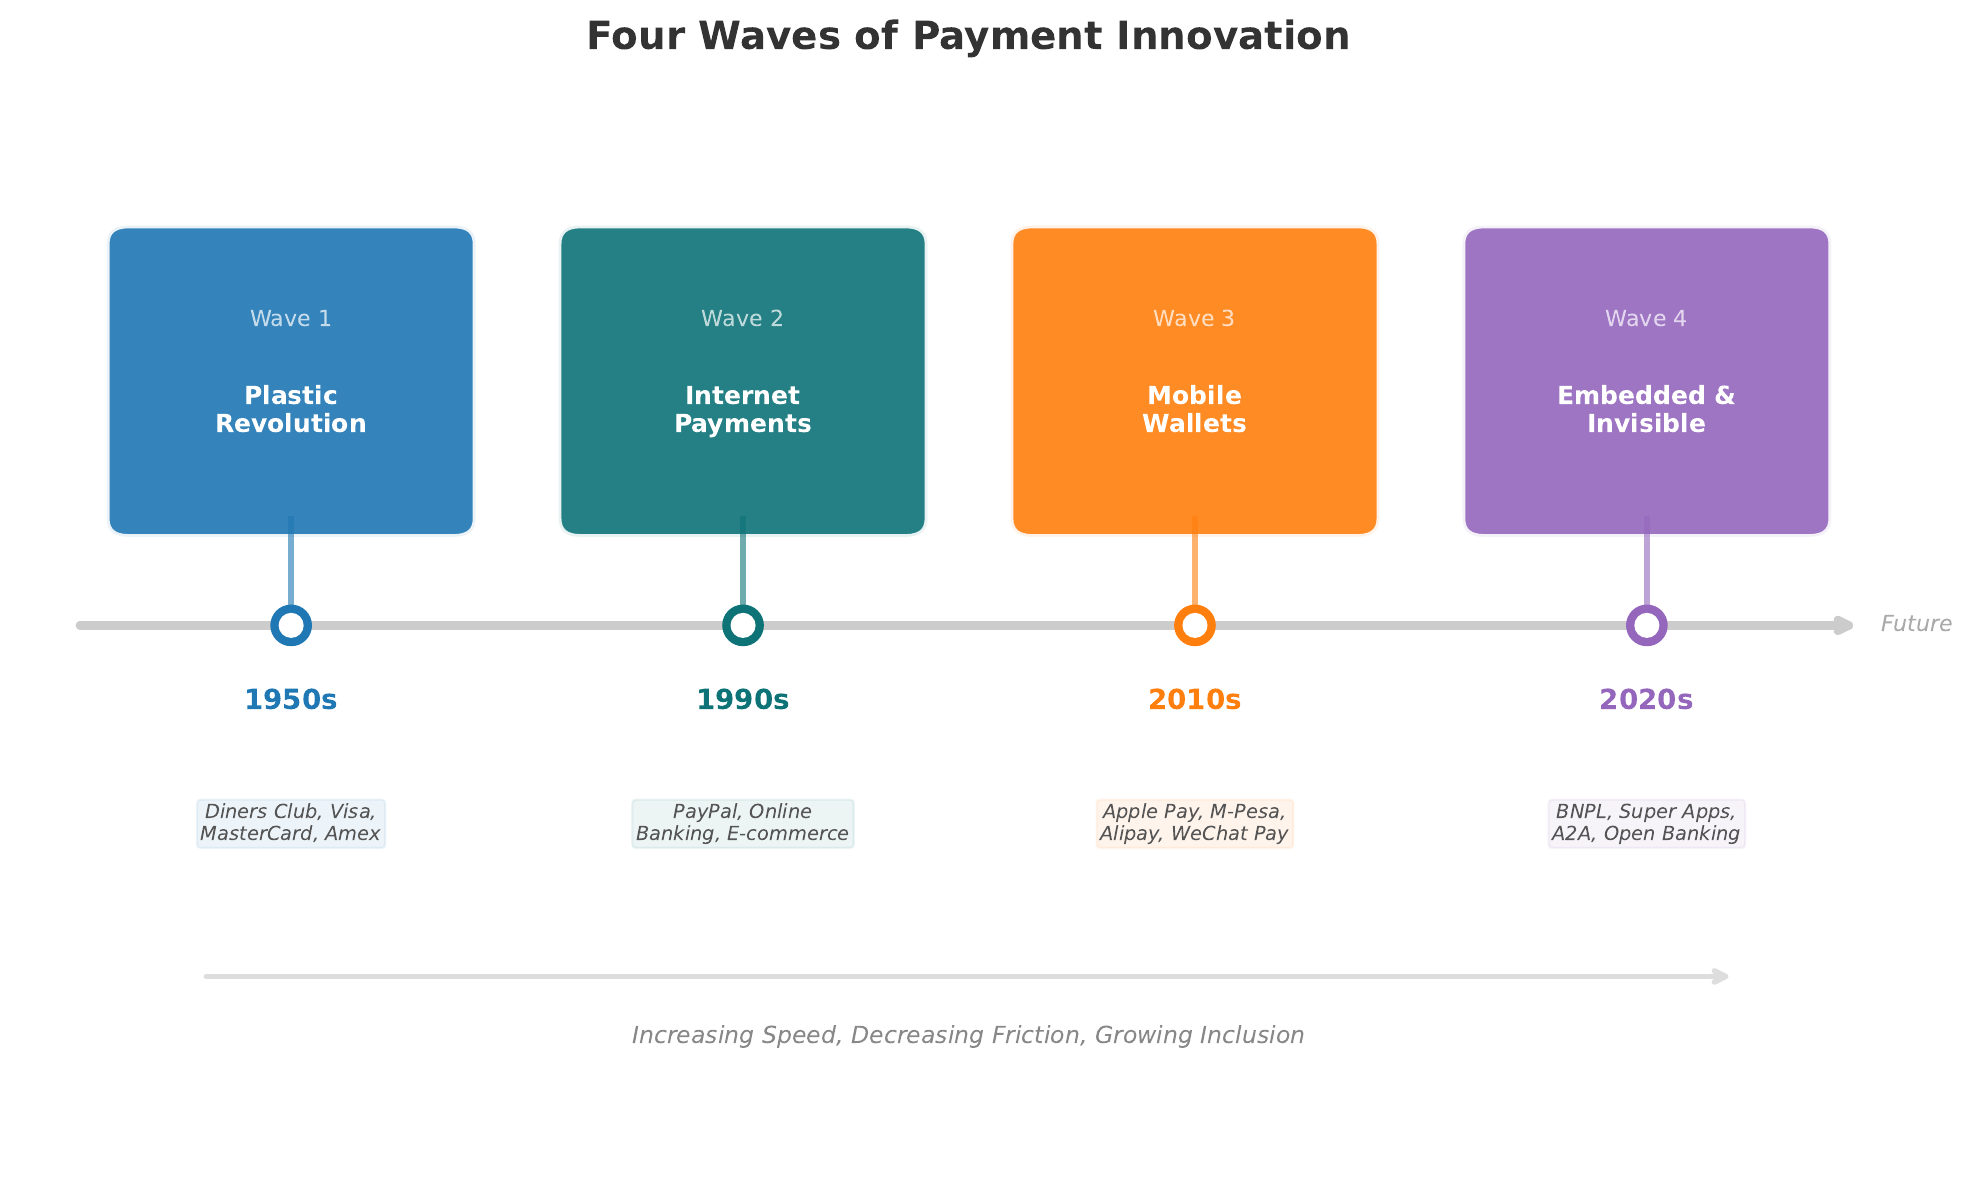
The history of payments is a story of progressive abstraction — from physical objects with intrinsic value to digital signals with institutional trust:
- Barter — Direct exchange of goods. Requires the "double coincidence of wants," making trade inefficient and limiting economic specialization.
- Commodity money — Shells, salt, cattle, and eventually precious metals. Durable, divisible, portable — but heavy and hard to verify.
- Coins and banknotes — Standardized, state-backed tokens. The first "platform" for payments, creating network effects around sovereign currencies.
- Checks and bank transfers — Paper-based instructions to move money between accounts. Introduced the concept of deferred settlement.
- Cards (credit and debit) — The first electronic payment network. Created the four-party model that dominates consumer payments to this day.
- Digital and mobile payments — From PayPal (1998) to M-Pesa (2007) to Apple Pay (2014). The smartphone becomes the terminal.
- Programmable money — CBDCs, stablecoins, and smart-contract-triggered payments. Money that executes logic autonomously.
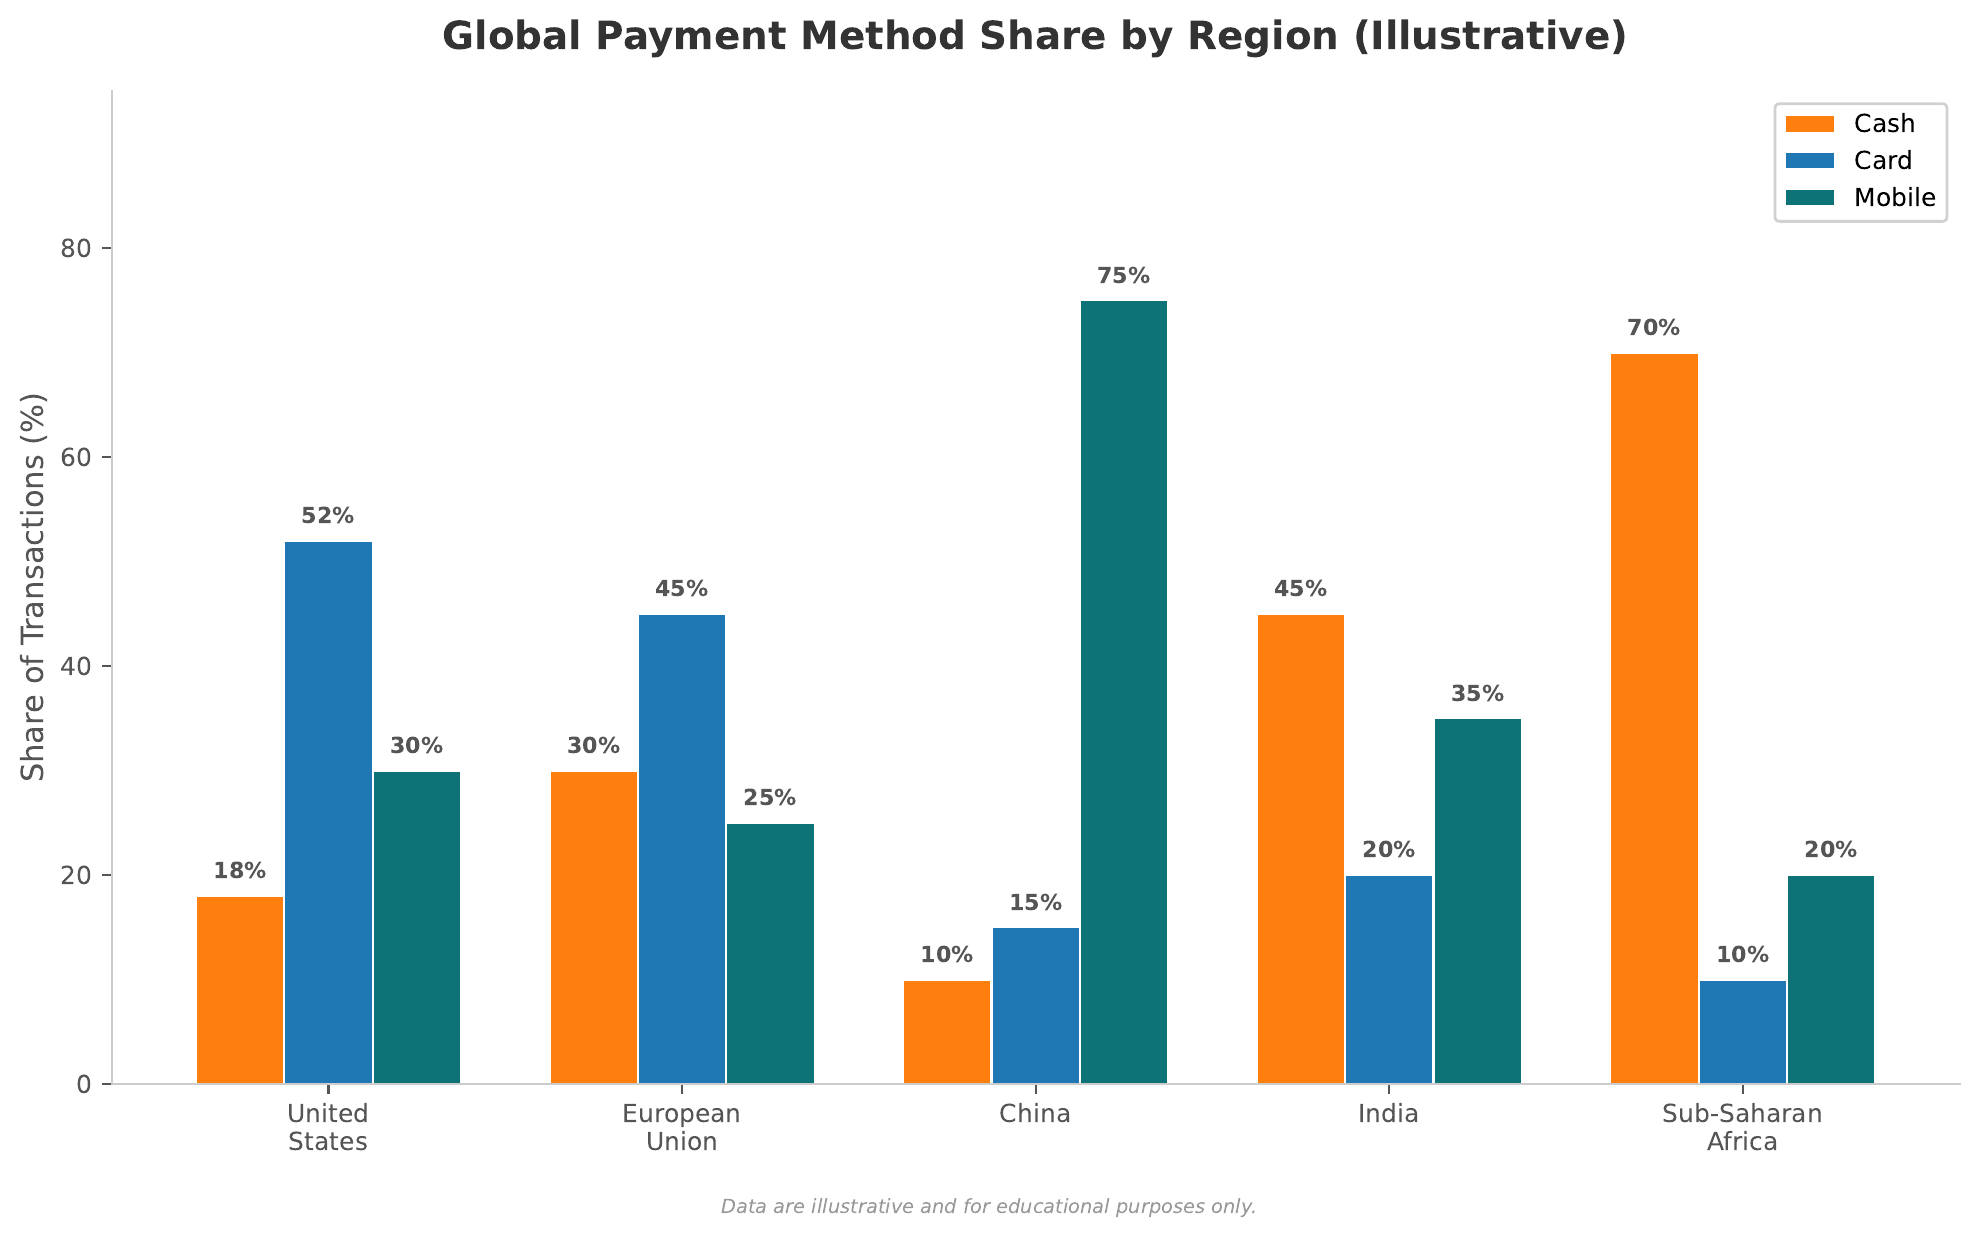
Sweden leads the global decline in cash usage. In 2023, cash accounted for less than 8% of point-of-sale transactions, down from over 40% a decade earlier. The Riksbank launched the e-krona pilot in 2020 to ensure a public digital alternative to private payment networks. Sweden's experience raises a critical question: what happens when cash disappears but digital access is not universal?
Key Insight: Abstraction and Trust
Each transition in payment history follows the same pattern: greater abstraction requires greater institutional trust. Barter requires no trust beyond the immediate exchange. Coins require trust in the sovereign. Bank transfers require trust in the banking system. Digital payments require trust in technology platforms. The question for CBDCs and stablecoins is: who provides the trust layer?
The Four-Party Payment Model
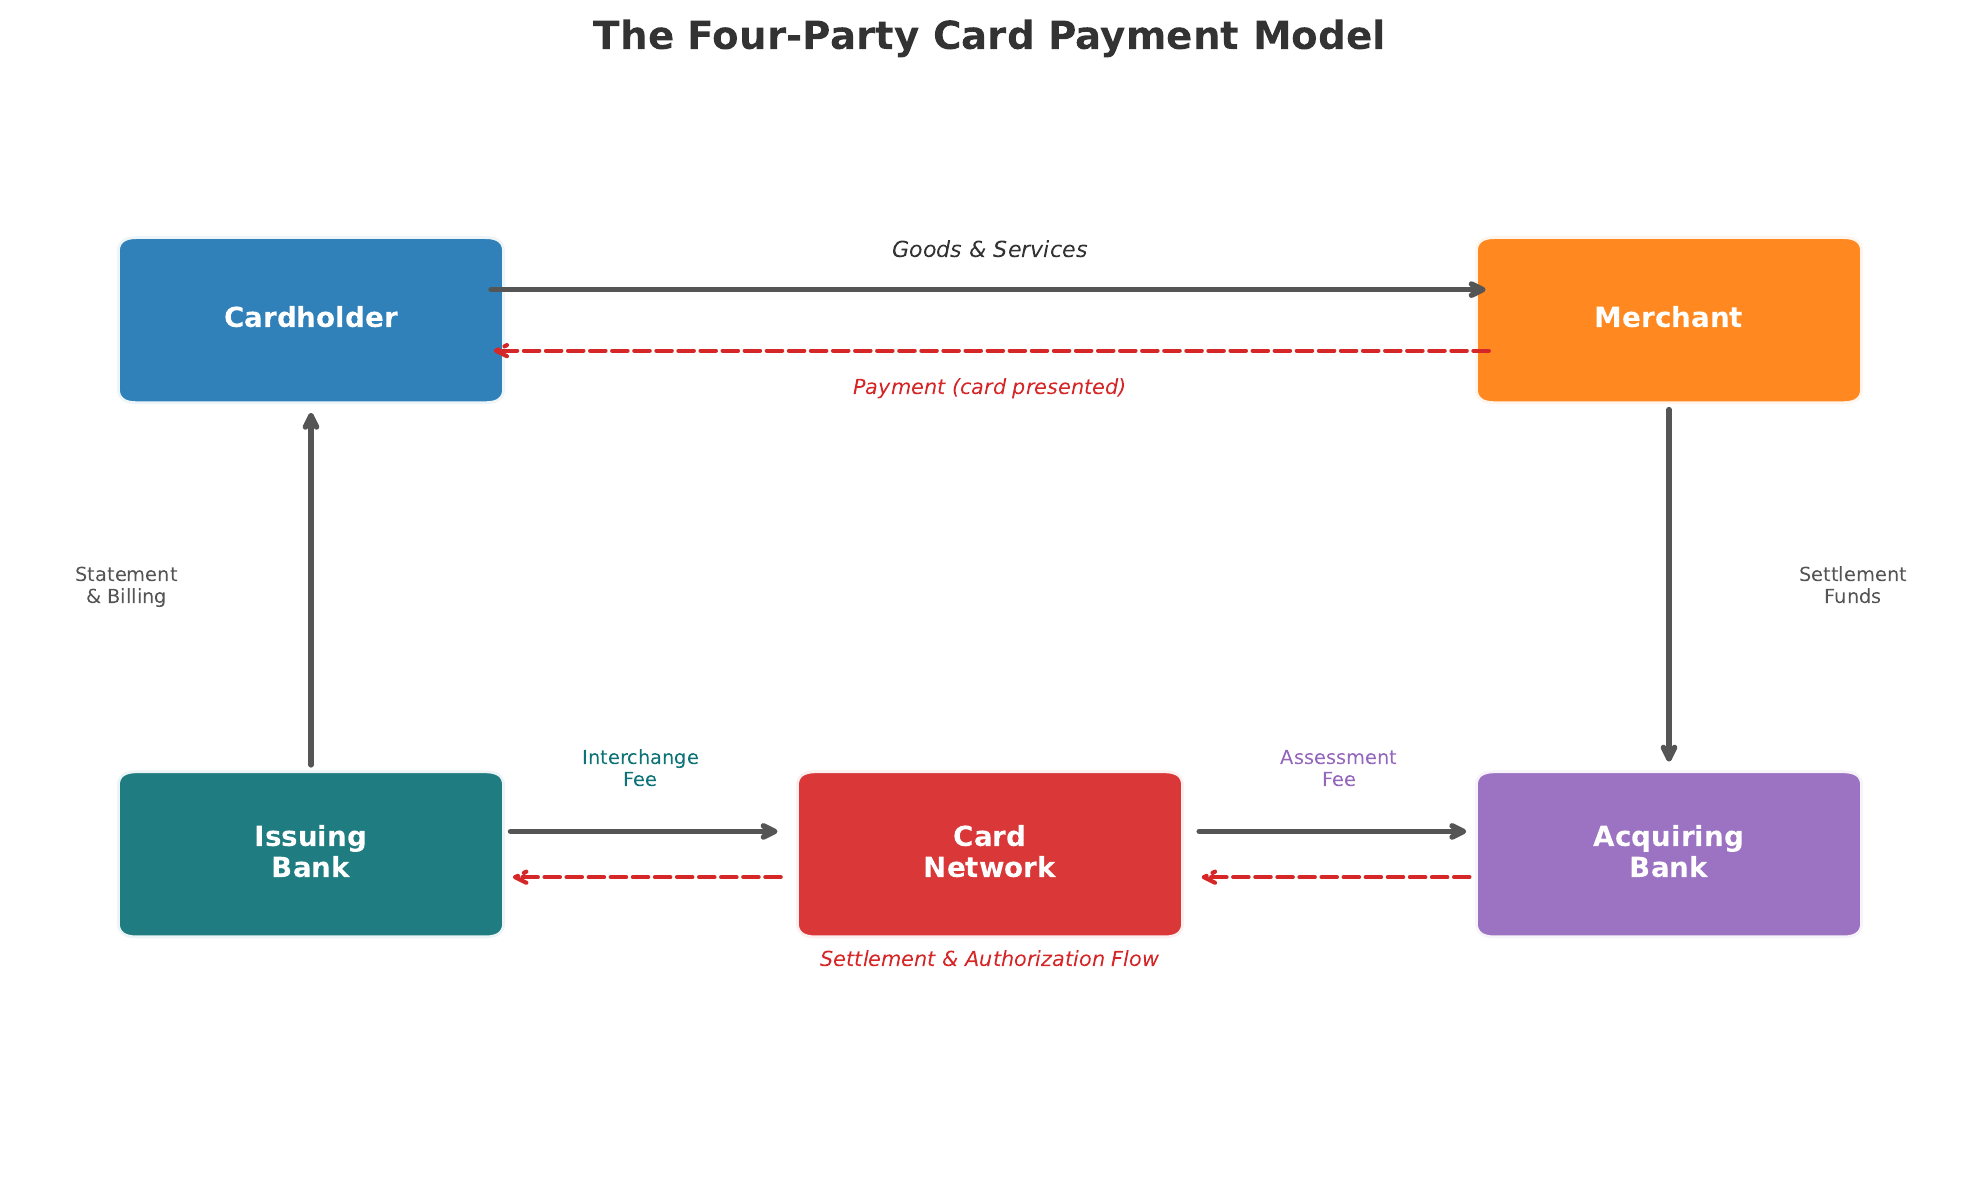
Frames 9–13 · Card Network Architecture, Payment LifecycleThe four-party model (also called the open-loop model) is the architecture that underpins Visa, Mastercard, and most card networks worldwide. Understanding this model is essential because fintech payment innovation either works within this structure or seeks to disrupt it.
The Four Parties
| Party | Role | Revenue Source |
|---|---|---|
| Cardholder | Initiates the payment; holds a card issued by their bank | N/A (pays annual fees, interest on credit) |
| Issuer | The cardholder's bank; approves/declines transactions; bears credit risk | Interchange fee + interest + cardholder fees |
| Card Network | Visa, Mastercard, etc.; provides the rails, sets rules, routes messages | Scheme/assessment fees (basis points per transaction) |
| Acquirer | The merchant's bank/processor; handles settlement and merchant onboarding | Acquirer margin (portion of MDR above interchange + scheme fees) |
| Merchant | Accepts the payment; delivers goods/services | Product revenue (net of payment costs) |
Payment Lifecycle: Authorization, Clearing, Settlement
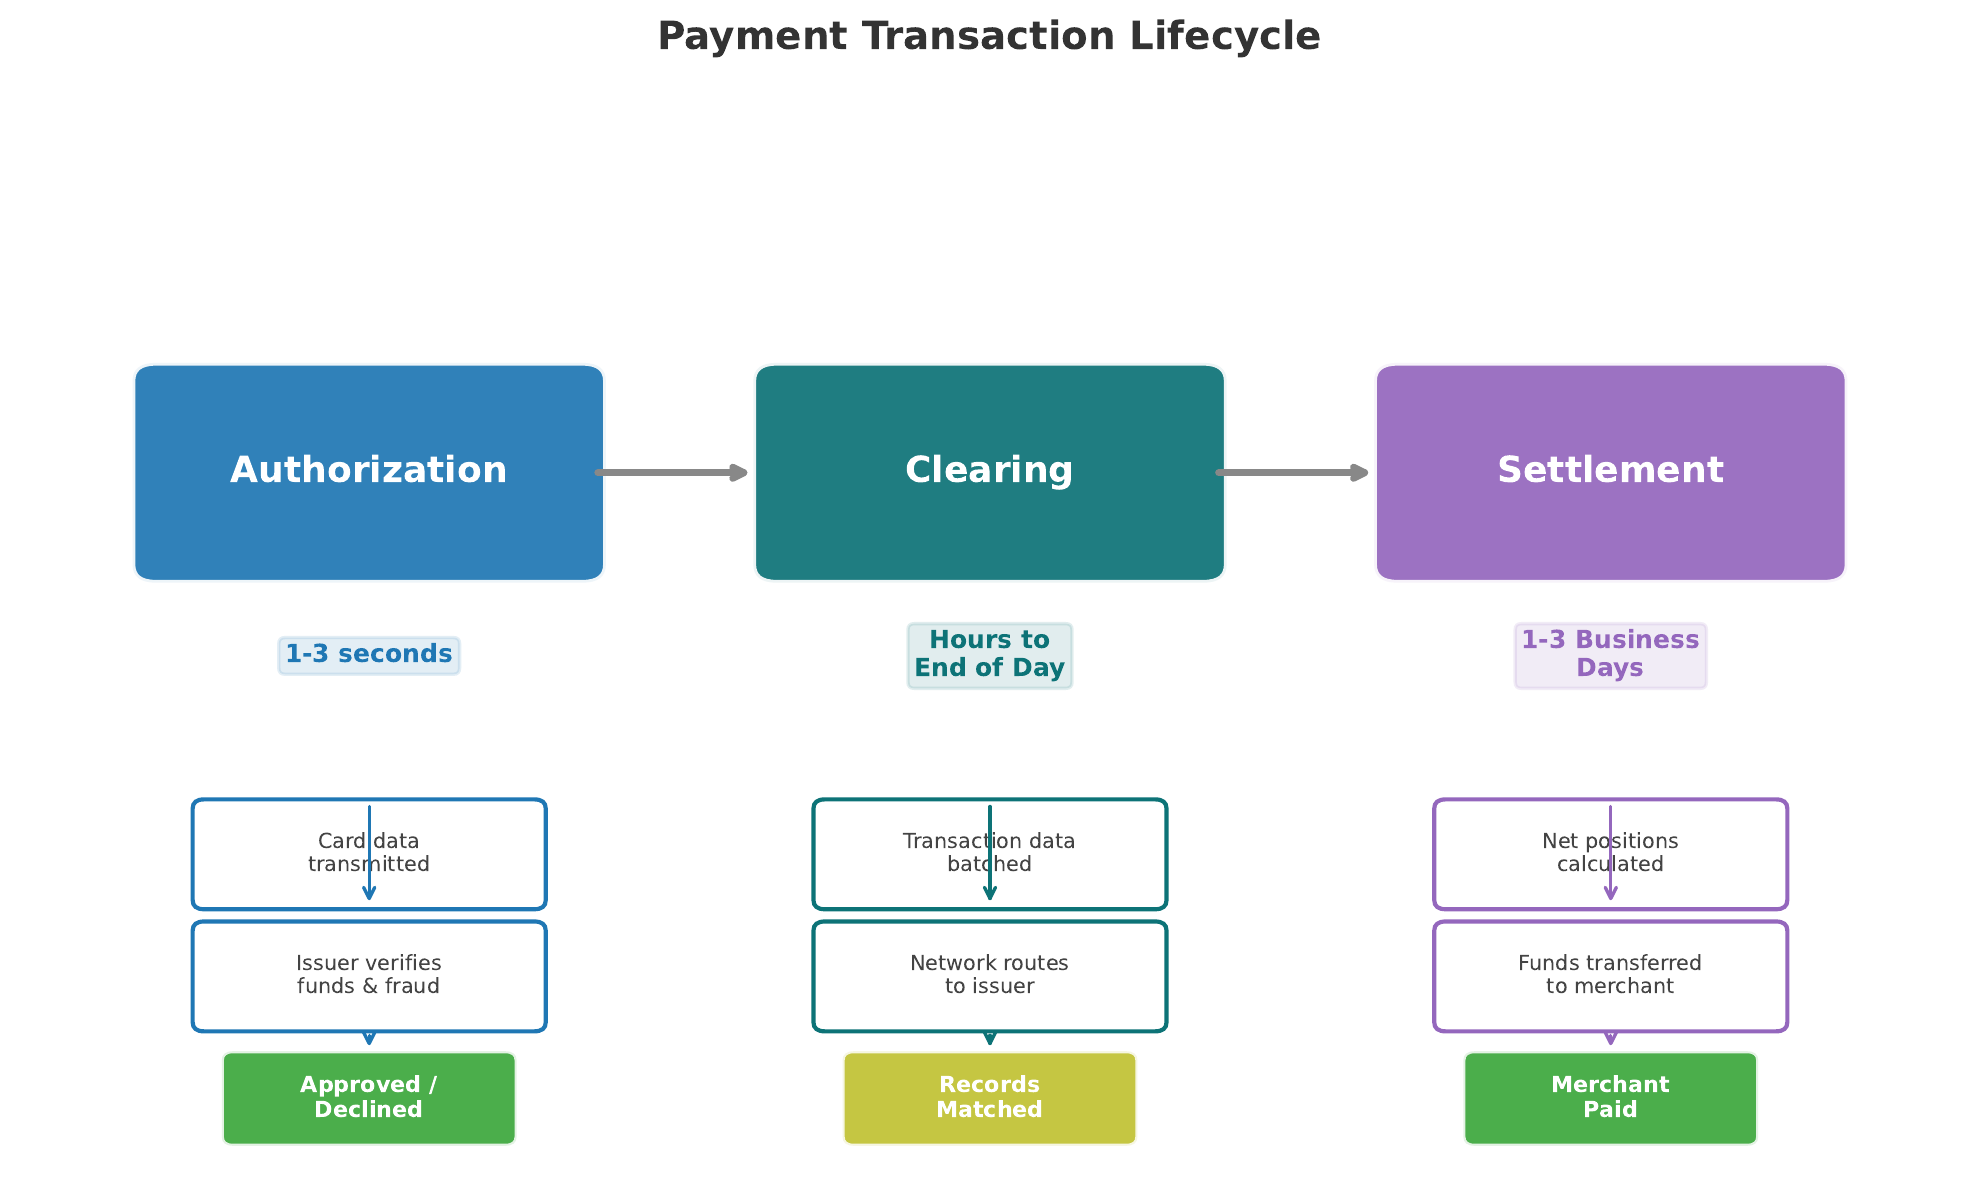
- Authorization — Real-time. The cardholder taps or swipes; the terminal sends a request through the acquirer and network to the issuer. The issuer checks funds, fraud rules, and limits, then responds with approve/decline. Takes 1–3 seconds.
- Clearing — Batch process. At end of day, acquirers and issuers exchange transaction details through the network. Net positions are calculated. This reduces the number of actual fund movements needed.
- Settlement — Fund transfer. The issuer transfers funds (minus interchange) to the acquirer, who deposits (minus acquirer margin) into the merchant's account. Typically T+1 or T+2.
The gap between authorization (instant) and settlement (days) creates float — money in limbo. Traditional processors earn interest on this float. Real-time payment systems like UPI and PIX collapse this gap to near-zero, fundamentally changing the economics. Buy-now-pay-later (BNPL) companies like Klarna and Affirm insert themselves into the authorization step, splitting the merchant's payment into installments.
Merchant Costs and Interchange Economics
Frames 14–18 · Interchange Fees, MDR, RegulationThe Merchant Discount Rate
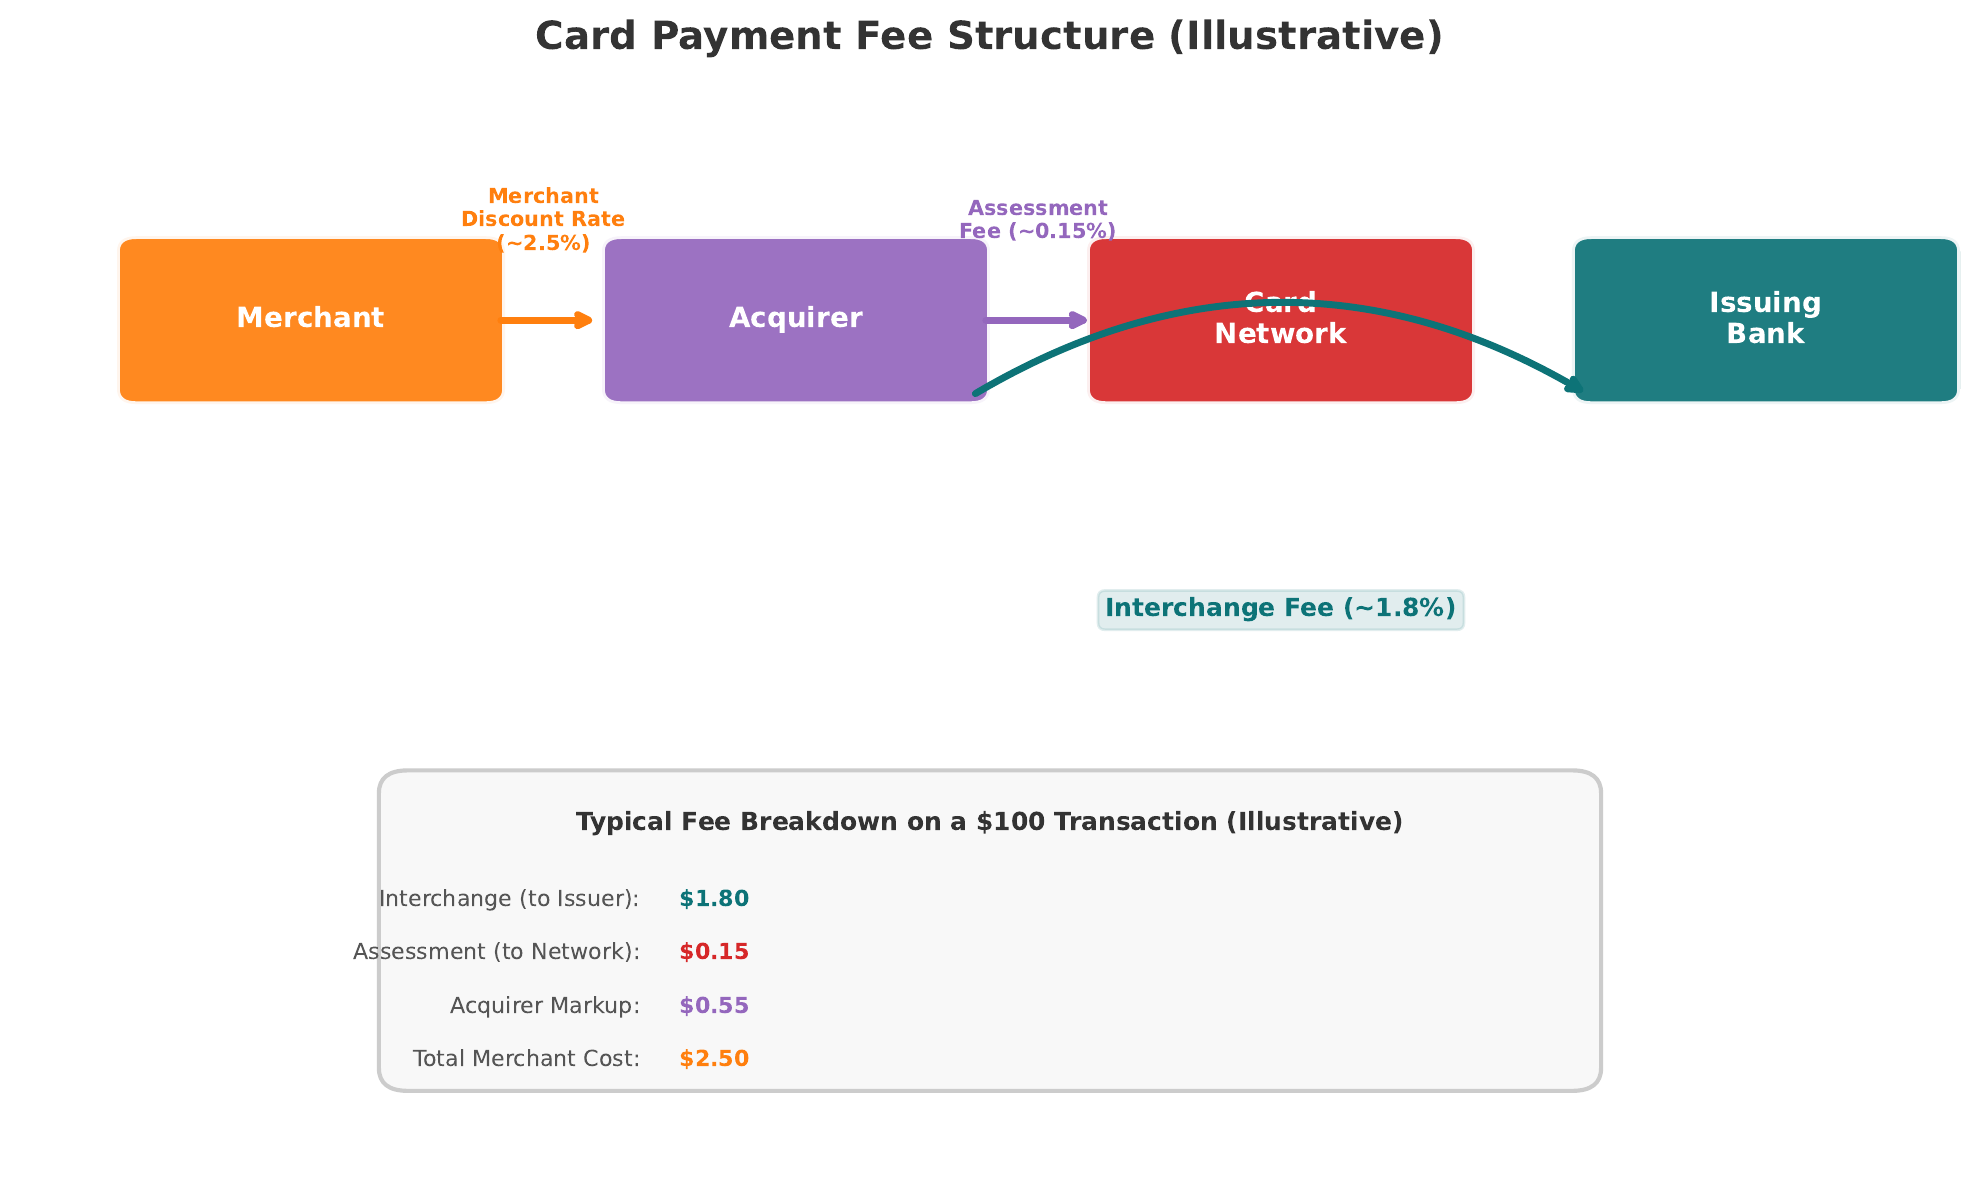
The total cost a merchant pays for accepting a card payment is called the Merchant Discount Rate (MDR). It is composed of three parts:
$\text{MDR} = \text{Interchange Fee} + \text{Scheme Fee} + \text{Acquirer Margin}$
Interchange is by far the largest component, typically 70–80% of the total MDR. This fee flows from the acquirer to the issuer and effectively subsidizes consumer-side benefits like rewards programs, fraud protection, and interest-free credit periods.
Cost Comparison Across Payment Methods
| Payment Method | Typical Cost (% of Transaction) | Key Cost Drivers |
|---|---|---|
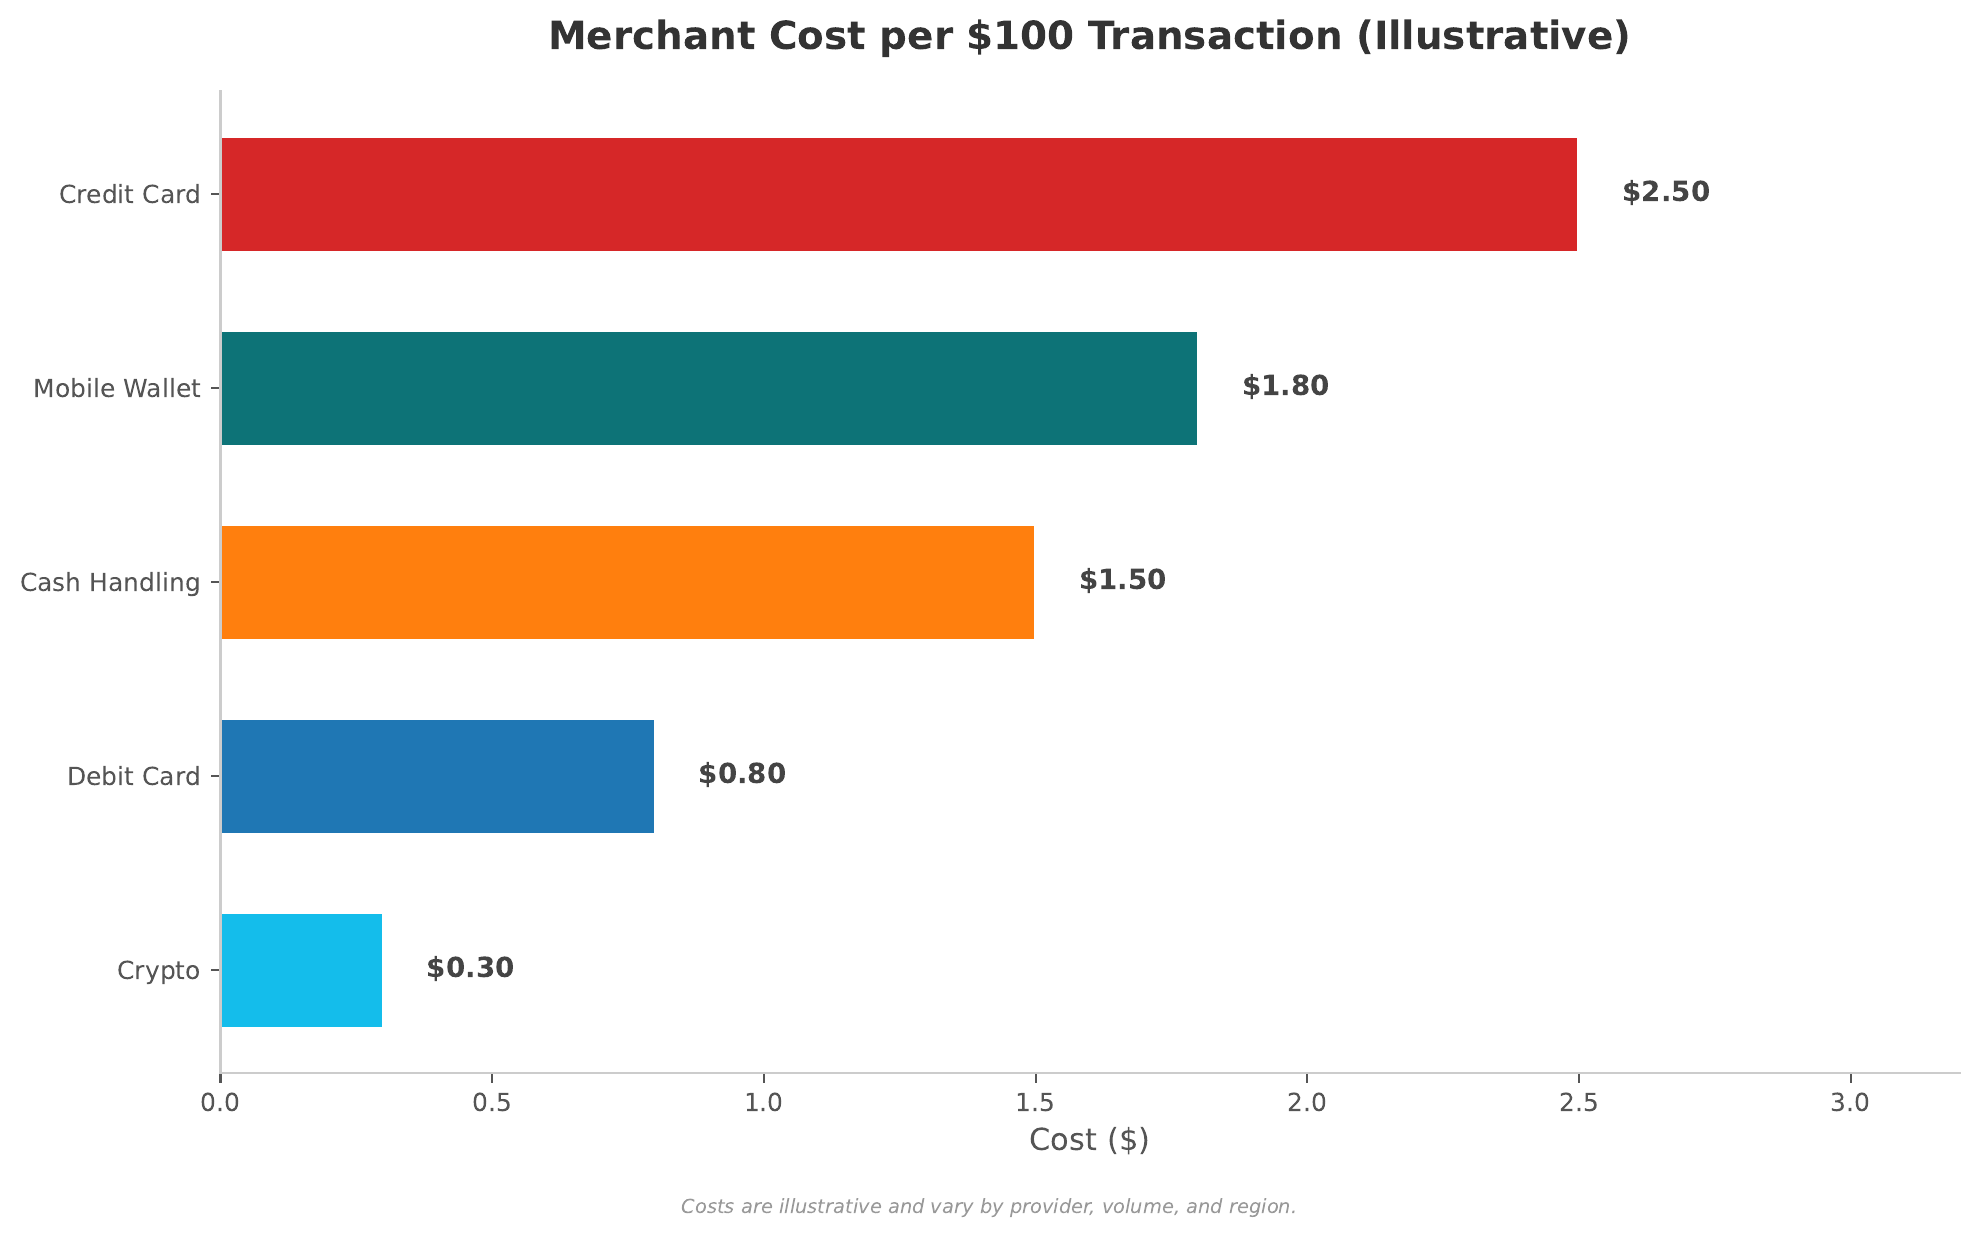
| Cash | 0.5–1.5% | Handling, counting, transport, insurance, shrinkage |
| Debit card | 0.3–1.0% | Regulated interchange (EU: 0.2% cap; US: Durbin cap) |
| Credit card | 1.5–3.5% | Higher interchange funds rewards; premium cards cost more |
| Mobile wallet | 1.0–2.5% | Pass-through of underlying card interchange + wallet fee |
| Real-time (UPI/PIX) | 0–0.5% | Government-subsidized; account-to-account; minimal intermediaries |
Interchange fees have been a battleground between card networks, issuers, and merchants for decades. Key regulatory interventions:
- Durbin Amendment (US, 2010): Capped debit interchange at approximately 21 cents + 0.05% for large issuers (assets > USD 10B). Reduced debit interchange by roughly 45% but had limited impact on credit cards.
- EU Interchange Fee Regulation (2015): Caps consumer debit at 0.2% and consumer credit at 0.3% of transaction value. Among the strictest caps globally.
- Australia (RBA, 2003+): Pioneer of interchange regulation; weighted average cap approach.
The unintended consequence: when interchange is capped, issuers often reduce consumer rewards and raise annual fees, shifting costs from merchants to cardholders.
Real-Time Payment Rails
Frames 19–22 · UPI, PIX, FedNow, Instant SettlementThe most significant payment innovation of the 2020s is the global proliferation of real-time payment systems — government-backed infrastructure that enables instant, 24/7, account-to-account transfers at near-zero cost. These systems bypass the card networks entirely, threatening the interchange-funded business model.
The Big Three: UPI, PIX, FedNow
| System | Country | Launch | Monthly Transactions (2024) | Key Design |
|---|---|---|---|---|
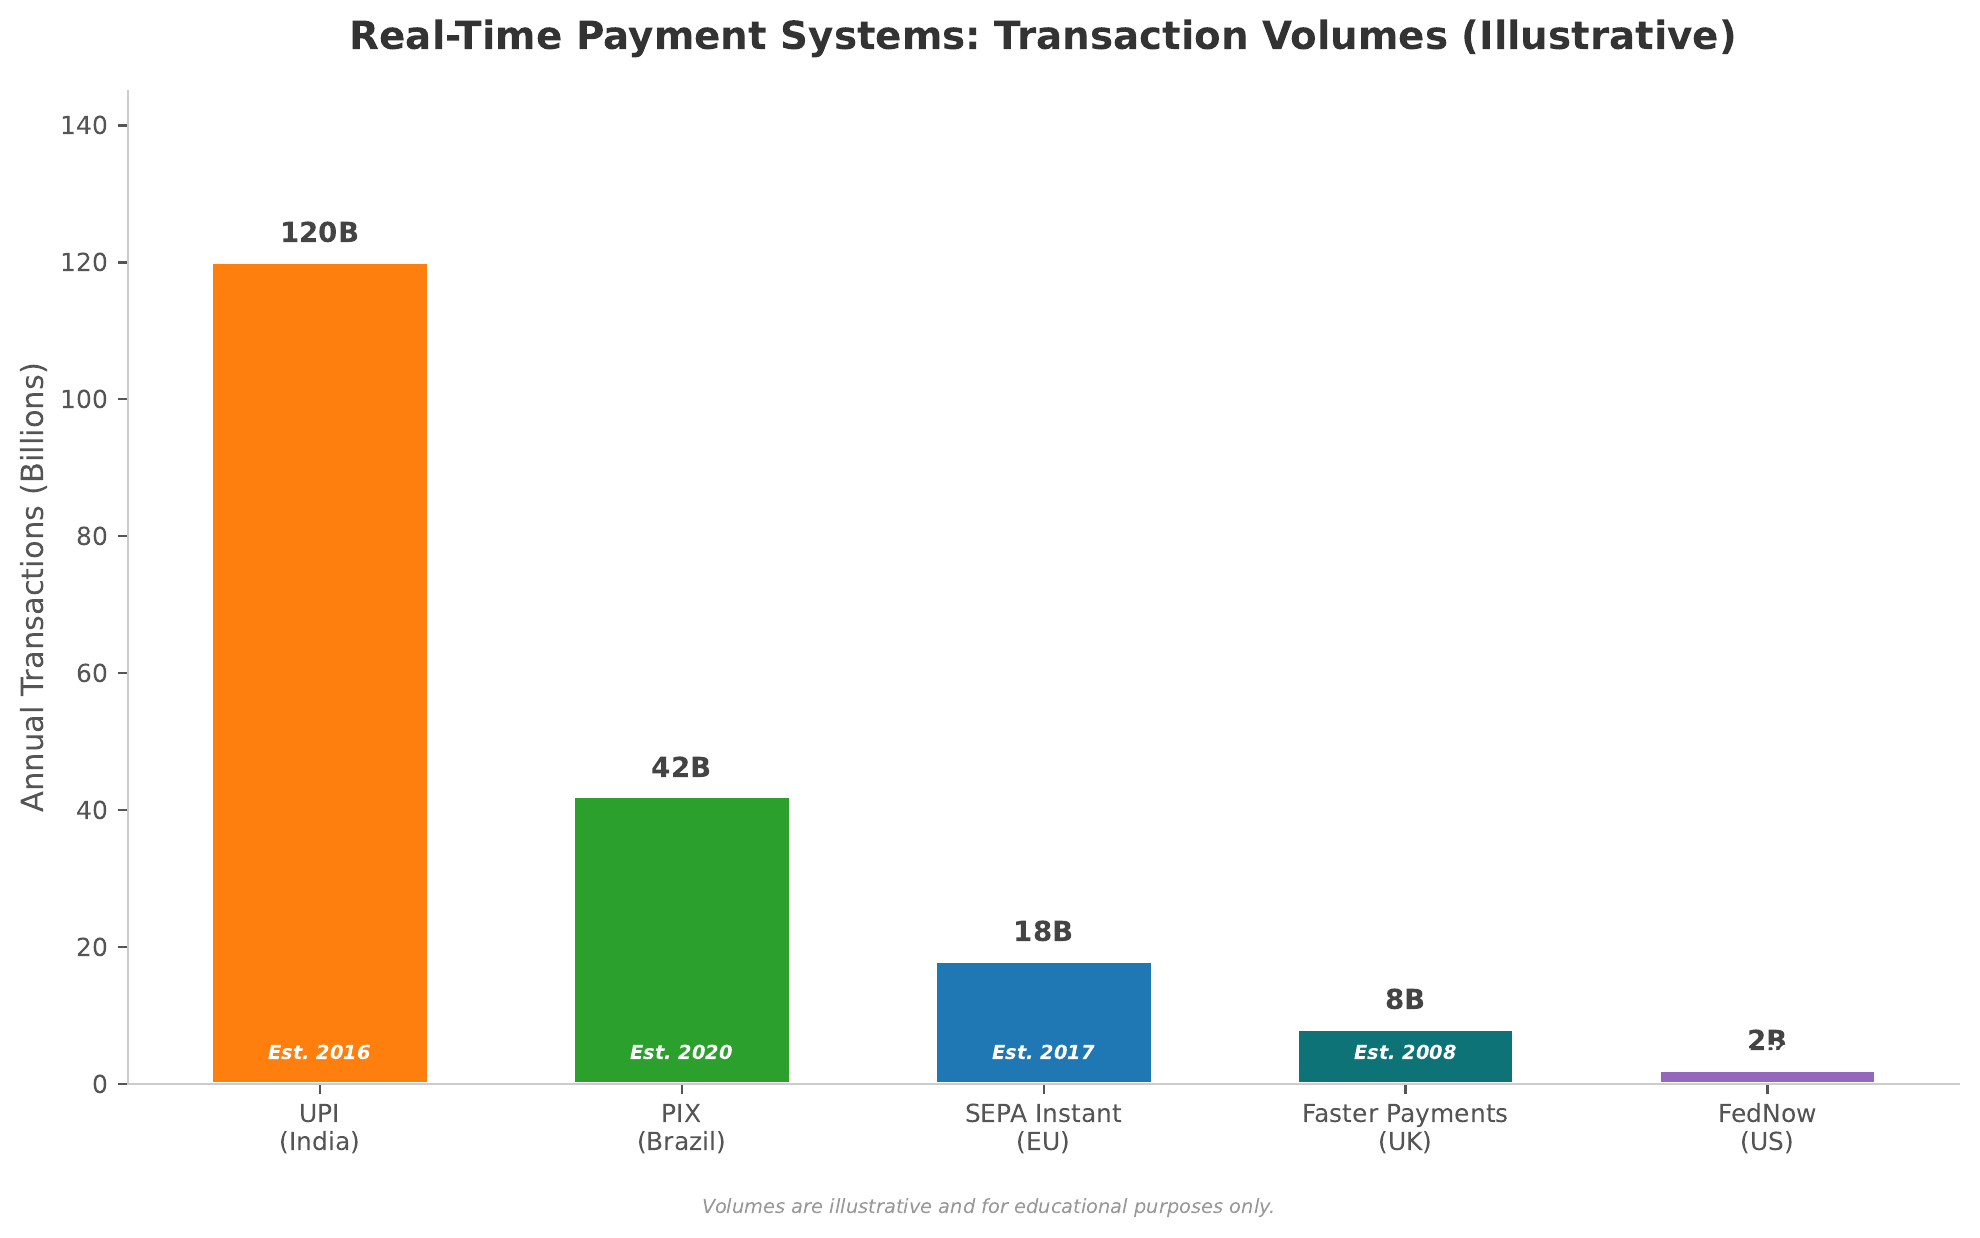
| UPI | India | 2016 | ~14 billion | Mobile-first; QR-based; zero MDR for small merchants; interoperable across all banks |
| PIX | Brazil | 2020 | ~5 billion | Central bank mandated; 24/7; free for individuals; QR + keys (phone/CPF/email) |
| FedNow | USA | 2023 | Early stage | Optional participation; USD 500K limit; designed to coexist with card networks |
Instant Settlement vs. Batch Clearing
- Settlement in T+1 or T+2 days
- Processors earn float income
- Merchants wait for funds
- Enables chargebacks and reversals
- Lower real-time infrastructure cost
- Settlement in seconds
- No float — changes business models
- Merchants get immediate liquidity
- Irreversibility increases fraud risk
- Requires 24/7 infrastructure
- UPI: Processes over 40% of all retail digital payments in India; grew from 0 to 14B monthly transactions in 8 years
- PIX: Reached 150 million users (70% of Brazilian adults) within 3 years of launch
- Global: Over 70 countries now operate or are building real-time payment systems
- Cost advantage: UPI merchant cost is 0% (government-subsidized) vs. 1.5–3% for credit cards
Cross-Border Payments
Frames 23–26 · Correspondent Banking, Remittances, Fintech DisruptionCross-border payments remain the most expensive, slow, and opaque corner of the global payment system. While domestic payments have been revolutionized by real-time rails, moving money across borders still relies on a correspondent banking model designed in the era of telegraphs.
The Correspondent Banking Problem
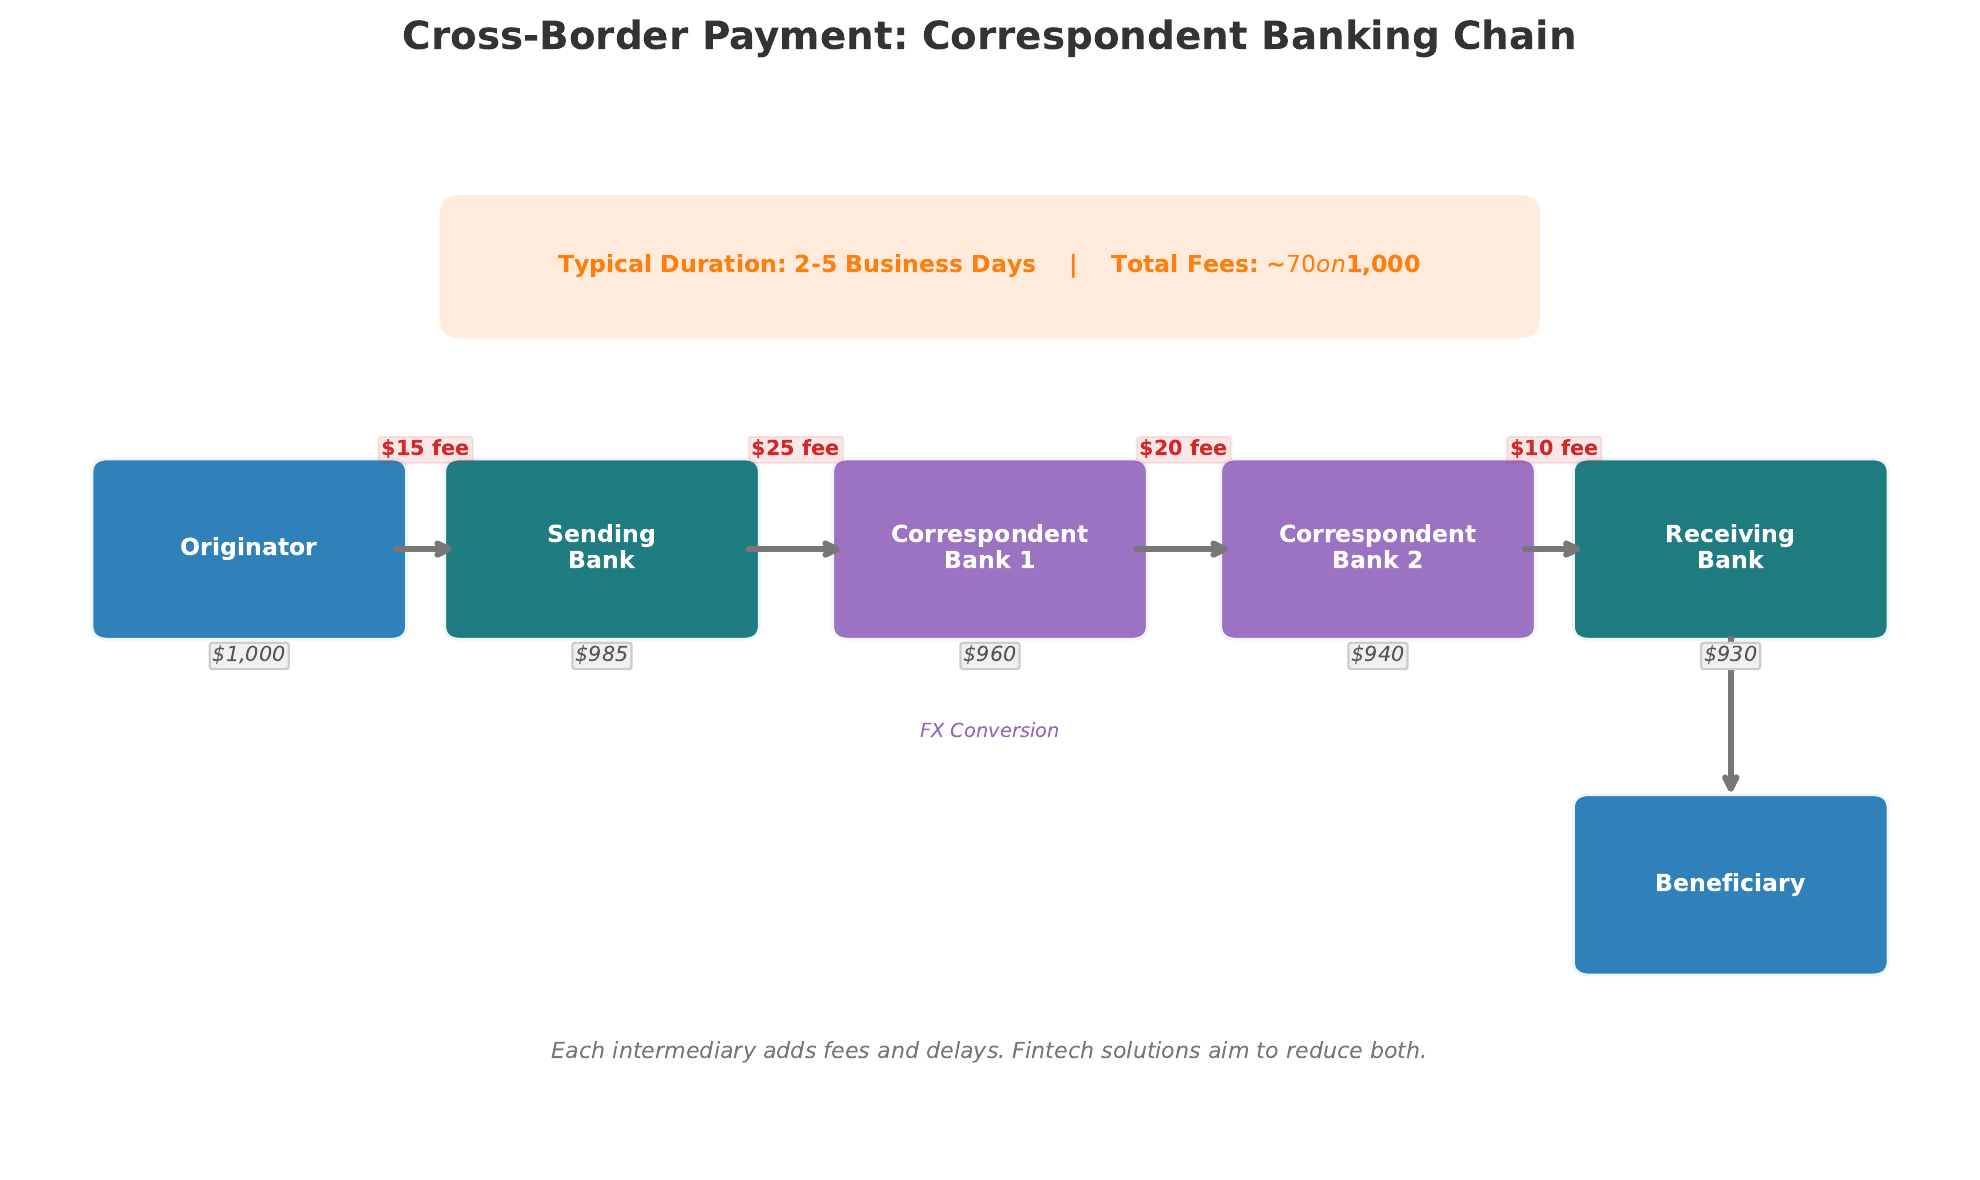
In the correspondent banking model, banks maintain nostro/vostro accounts with partner banks in foreign jurisdictions. A payment from Country A to Country B may traverse multiple intermediary banks, each adding:
- Fees — lifting charges, intermediary fees, FX spreads (often opaque)
- Delay — 2–5 business days for a typical transfer; up to 10 days for exotic corridors
- Opacity — the sender often cannot track where the payment is or predict the final amount received
- Compliance friction — each intermediary runs its own KYC/AML checks, creating duplicated effort
Remittance Costs and Financial Inclusion
Remittances — money sent by migrant workers to their families — represent a USD 650+ billion annual flow to developing economies. The World Bank's Sustainable Development Goal target is to reduce the average cost of remittances to below 3% by 2030. As of 2024, the global average remains around 6.2%, with some corridors exceeding 10%.
At an average 6.2% cost, the world's migrant workers collectively pay approximately USD 40 billion per year in remittance fees. This money is disproportionately extracted from the lowest-income workers sending the smallest amounts, where fixed fees hit hardest. Fintech companies like Wise (formerly TransferBank), Remitly, and M-Pesa have reduced costs on specific corridors to 1–3%, proving that lower costs are technically feasible.
Fintech Solutions
- Wise (TransferWise): Peer-matching model avoids correspondent banking; mid-market FX rate with transparent fixed fees
- Ripple / XRP: Uses blockchain-based messaging (RippleNet) to pre-fund liquidity, reducing settlement time to seconds
- SWIFT gpi: Incumbent response — end-to-end tracking, same-day settlement for 50% of payments, fee transparency
- Stablecoin rails: USDC/USDT transfers on blockchain settle in minutes at minimal cost, bypassing correspondent banking entirely
Digital Currencies and Programmable Money
Frames 27–30 · CBDCs, Stablecoins, Two-Sided MarketsThe frontier of payments innovation is programmable money — digital currency that can carry rules, conditions, and logic within the money itself. This section examines the two leading approaches: central bank digital currencies (CBDCs) and privately issued stablecoins.
CBDC Design Trade-Offs
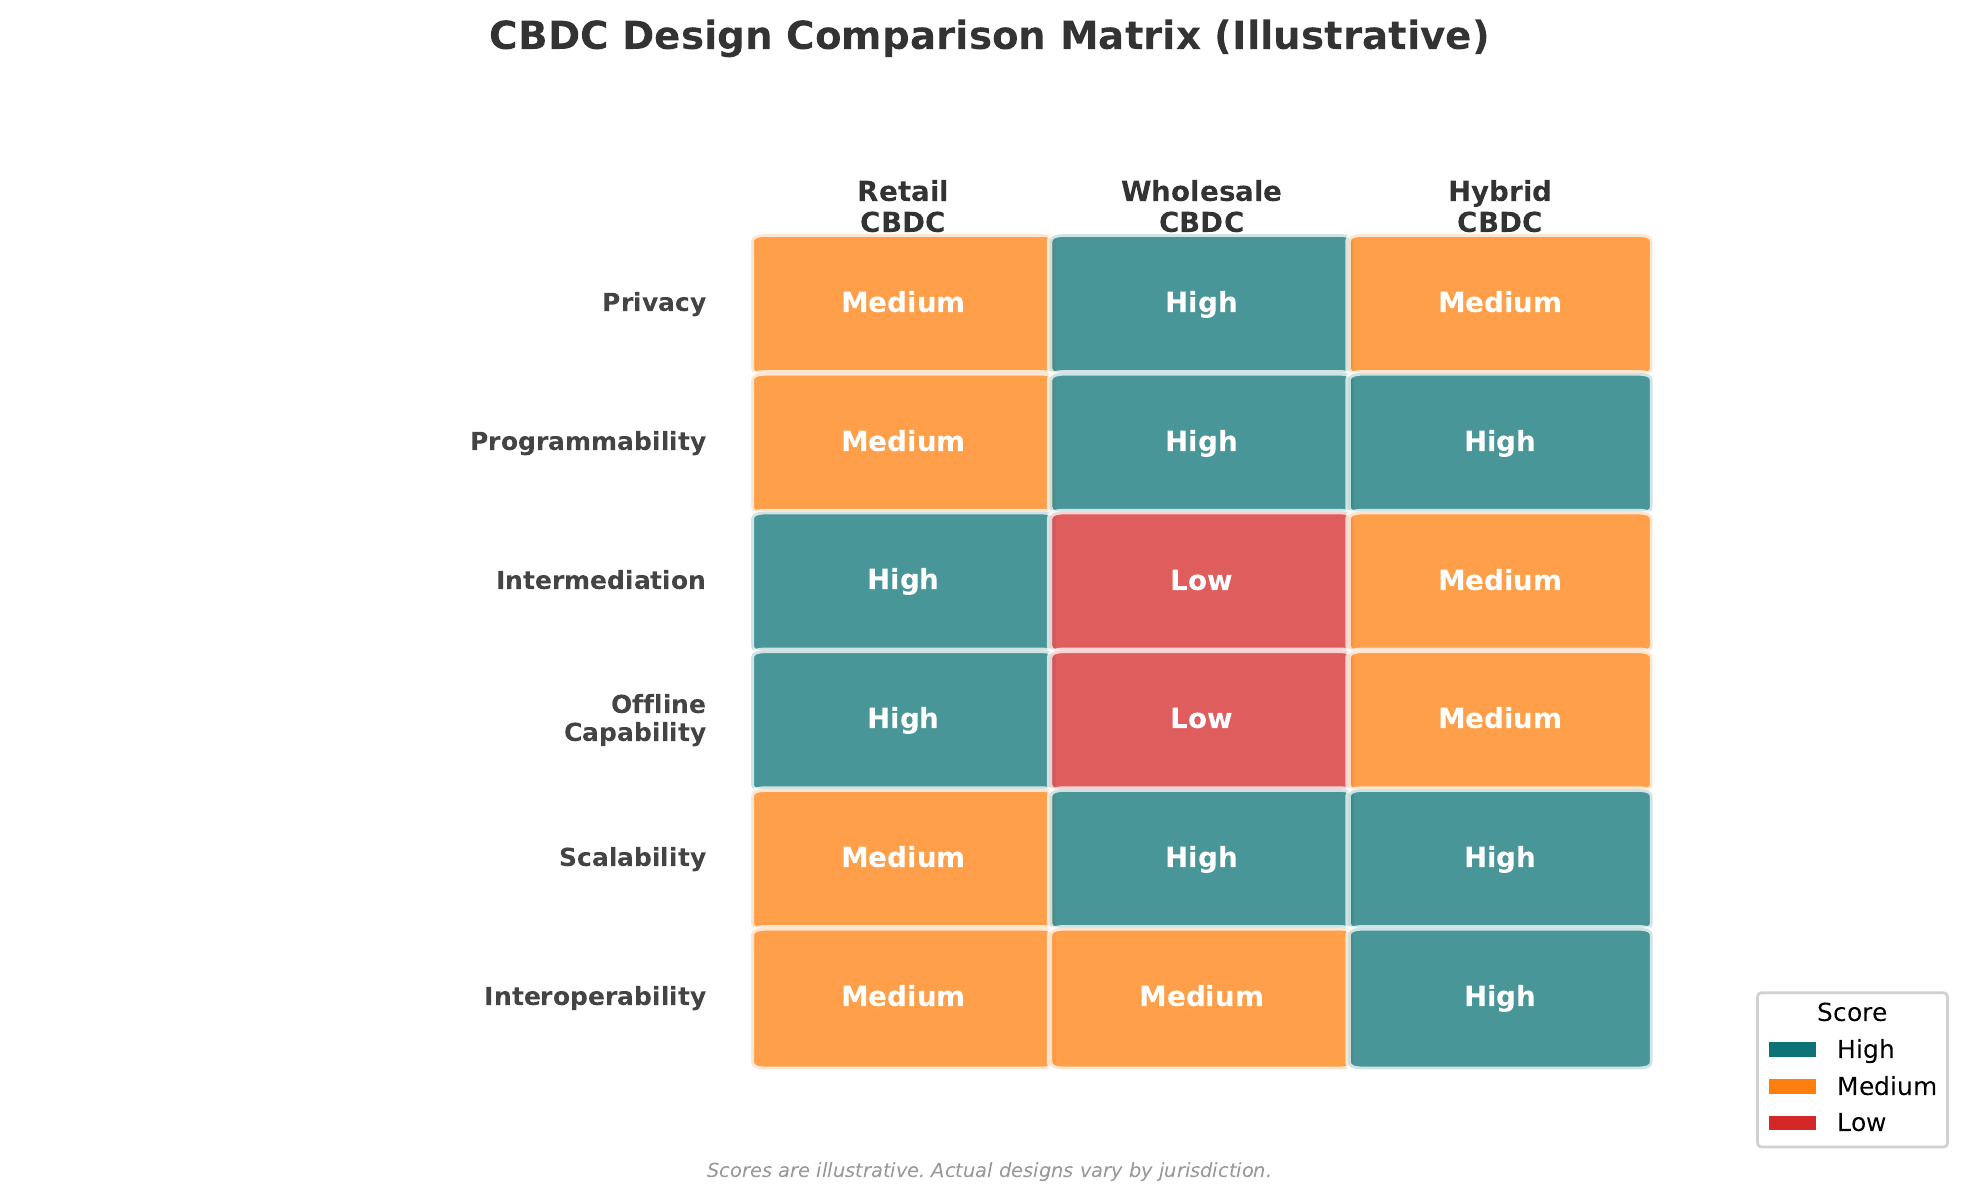
| Design Dimension | Option A | Option B | Trade-Off |
|---|---|---|---|
| Scope | Retail (public) | Wholesale (banks only) | Inclusion vs. simplicity |
| Architecture | Account-based | Token-based | Identity verification vs. cash-like privacy |
| Infrastructure | Centralized ledger | Distributed ledger | Performance vs. resilience |
| Intermediation | Direct (central bank to public) | Two-tier (via commercial banks) | Disintermediation risk vs. leveraging existing infrastructure |
| Interest | Interest-bearing | Non-interest-bearing | Monetary policy tool vs. bank deposit competition |
Stablecoins vs. CBDCs
- Issued by central banks — sovereign backing
- Legal tender status possible
- Privacy-preserving designs feasible
- Monetary policy tool (programmable rates)
- Risk: financial disintermediation
- 130+ countries exploring (2024)
- Issued by private companies
- Pegged to fiat (USDT, USDC) or algorithmic
- Already operational at scale (~USD 150B market cap)
- 24/7 settlement on public blockchains
- Risk: reserve transparency, de-pegging
- Regulatory frameworks emerging (MiCA, US bills)
The Rochet-Tirole Two-Sided Market Model
Payment networks are a textbook example of a two-sided market (Rochet & Tirole, 2003). The platform must attract both buyers (cardholders) and sellers (merchants) simultaneously. The optimal pricing is not simply cost-plus, but a balancing act between the two sides:
$p_B + p_S = c + m$
where $p_B$ is the buyer-side fee, $p_S$ is the seller-side fee, $c$ is the platform's marginal cost per transaction, and $m$ is the platform's margin. The key insight is that the allocation of the total price between sides matters as much as the total level:
$\pi^* = \max_{p_B, p_S} \left[ (p_B + p_S - c) \cdot D_B(p_B) \cdot D_S(p_S) \right]$
In practice, card networks set $p_B$ low (even negative via rewards) and $p_S$ high (interchange) because cardholder demand is more price-elastic — subsidizing the more elastic side maximizes total transaction volume. This is why merchants pay 2–3% while cardholders often pay nothing or even receive cashback.
Consider the three competing visions for the future of payments:
- Central banks issue CBDCs — sovereign, potentially privacy-preserving, but slow to innovate
- Big tech embeds payments into platforms — frictionless but raises data monopoly concerns
- Decentralized protocols enable permissionless value transfer — censorship-resistant but volatile and energy-intensive
Which model best serves financial inclusion? Which best preserves monetary sovereignty? Can they coexist?
Key Takeaways
Frame 31 · Synthesis and Next StepsCore Takeaways from L03
- Payments are the backbone of fintech. Every financial product — lending, insurance, investing — depends on reliable payment infrastructure. Understanding payment rails is prerequisite to understanding fintech.
- The four-party model creates value and friction simultaneously. Interchange fees fund consumer rewards but burden merchants. Regulatory intervention (Durbin, EU IFR) attempts to rebalance but creates second-order effects.
- Real-time payment systems are reshaping global finance. UPI and PIX demonstrate that near-zero-cost, instant payments are technically feasible at massive scale. The question is sustainability and governance.
- Cross-border payments remain the last frontier. Correspondent banking costs USD 40B+ annually in excess fees. Fintechs, stablecoins, and CBDCs are competing to solve this problem.
- Payment networks are two-sided markets. The Rochet-Tirole framework explains why cardholders are subsidized while merchants pay — and why simple cost-based regulation can produce unintended consequences.
- Programmable money will transform payments from passive pipes to active infrastructure. CBDCs and stablecoins introduce the possibility of money that carries rules, enabling conditional payments, automated compliance, and new financial products.
Lecture 4: Fintech Security and Regulation — RegTech builds on L03's payment infrastructure by examining the security threats, regulatory frameworks, and compliance technologies that protect the payment ecosystem. Topics include fraud detection (AI/ML), authentication (biometrics, SCA), data privacy (GDPR, PSD2), and the emerging field of regulatory technology (RegTech).