This lecture shifts the lens from supply-side strategy to demand-side behavior. It examines the four drivers of fintech growth, the persistent challenge of financial inclusion, the behavioral economics of trust and adoption, and the power of choice architecture and nudging in financial product design. By the end, you will have both a behavioral vocabulary and a five-question ecosystem evaluation framework that complements L01's strategic framework.
- Identify the four drivers of fintech growth and explain their interdependence. [Understand]
- Explain why financial inclusion remains incomplete despite technological progress, distinguishing access barriers from behavioral barriers. [Understand]
- Apply the technology adoption lifecycle to predict which fintech products will cross the chasm and which will stall. [Apply]
- Analyze how choice architecture and nudging mechanisms shape financial decisions — for good and for ill. [Analyze]
- Evaluate the ethical boundary between helpful nudging and manipulative dark patterns in financial product design. [Evaluate]
Bloom's levels covered: Understand, Apply, Analyze, Evaluate
Why the Fintech Ecosystem Matters
Frames 1–4 · Opening, Learning Objectives, Bridge from L01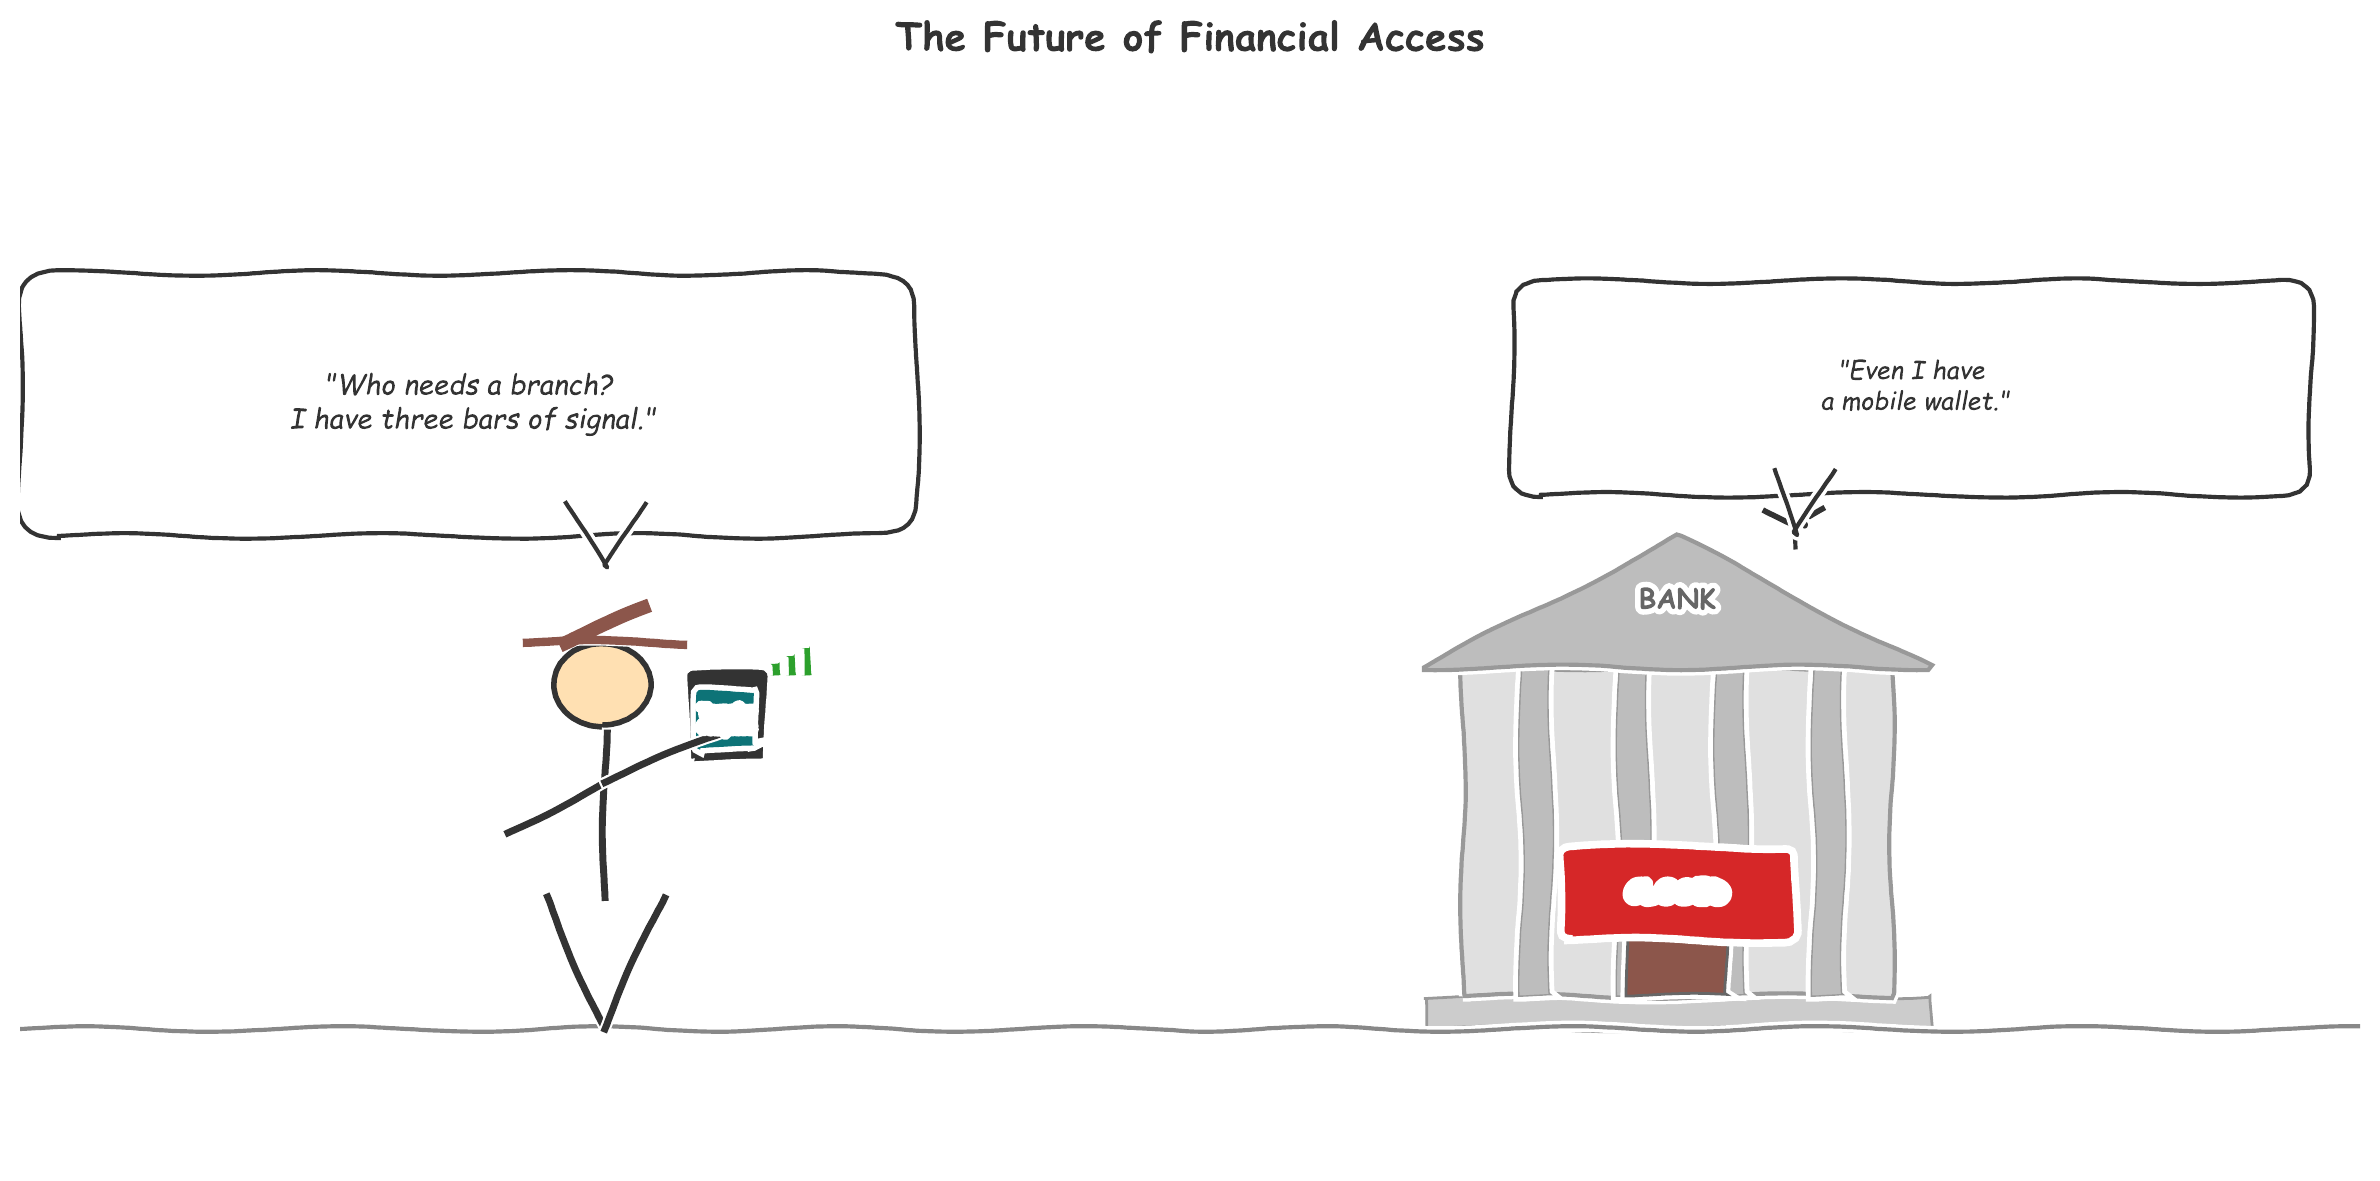
In Lecture 1 we established what fintech is, where it came from, and how banks and fintechs collaborate. Now we ask the deeper questions: Who does fintech serve? Why do some people adopt it while others resist? How do product design choices shape financial decisions?
L02 shifts the lens from supply-side strategy to demand-side behavior. The fintech ecosystem is not just technology companies and banks — it is a behavioral system where trust, cognitive biases, and design choices determine who benefits and who is excluded.
Open your banking app right now. Look at the home screen. What is the default view — spending, savings, or investments? Who decided that default? What happens if you try to close your account — is it as easy as opening one was?
- Find one nudge in your financial apps — a default, a prompt, a design choice that steers your behavior.
- Is it helping you or helping the company?
- Would you behave differently without it?
Bring your example to the discussion.
"Every one of those choices is a nudge. The tension between helpful nudges and dark patterns is the ethical core of this lecture."
Growth Drivers and Financial Inclusion
Frames 6–9 · Four Drivers, Economic Benefits, Unbanked Challenge, M-PesaThe Fintech Growth Engine — Four Drivers
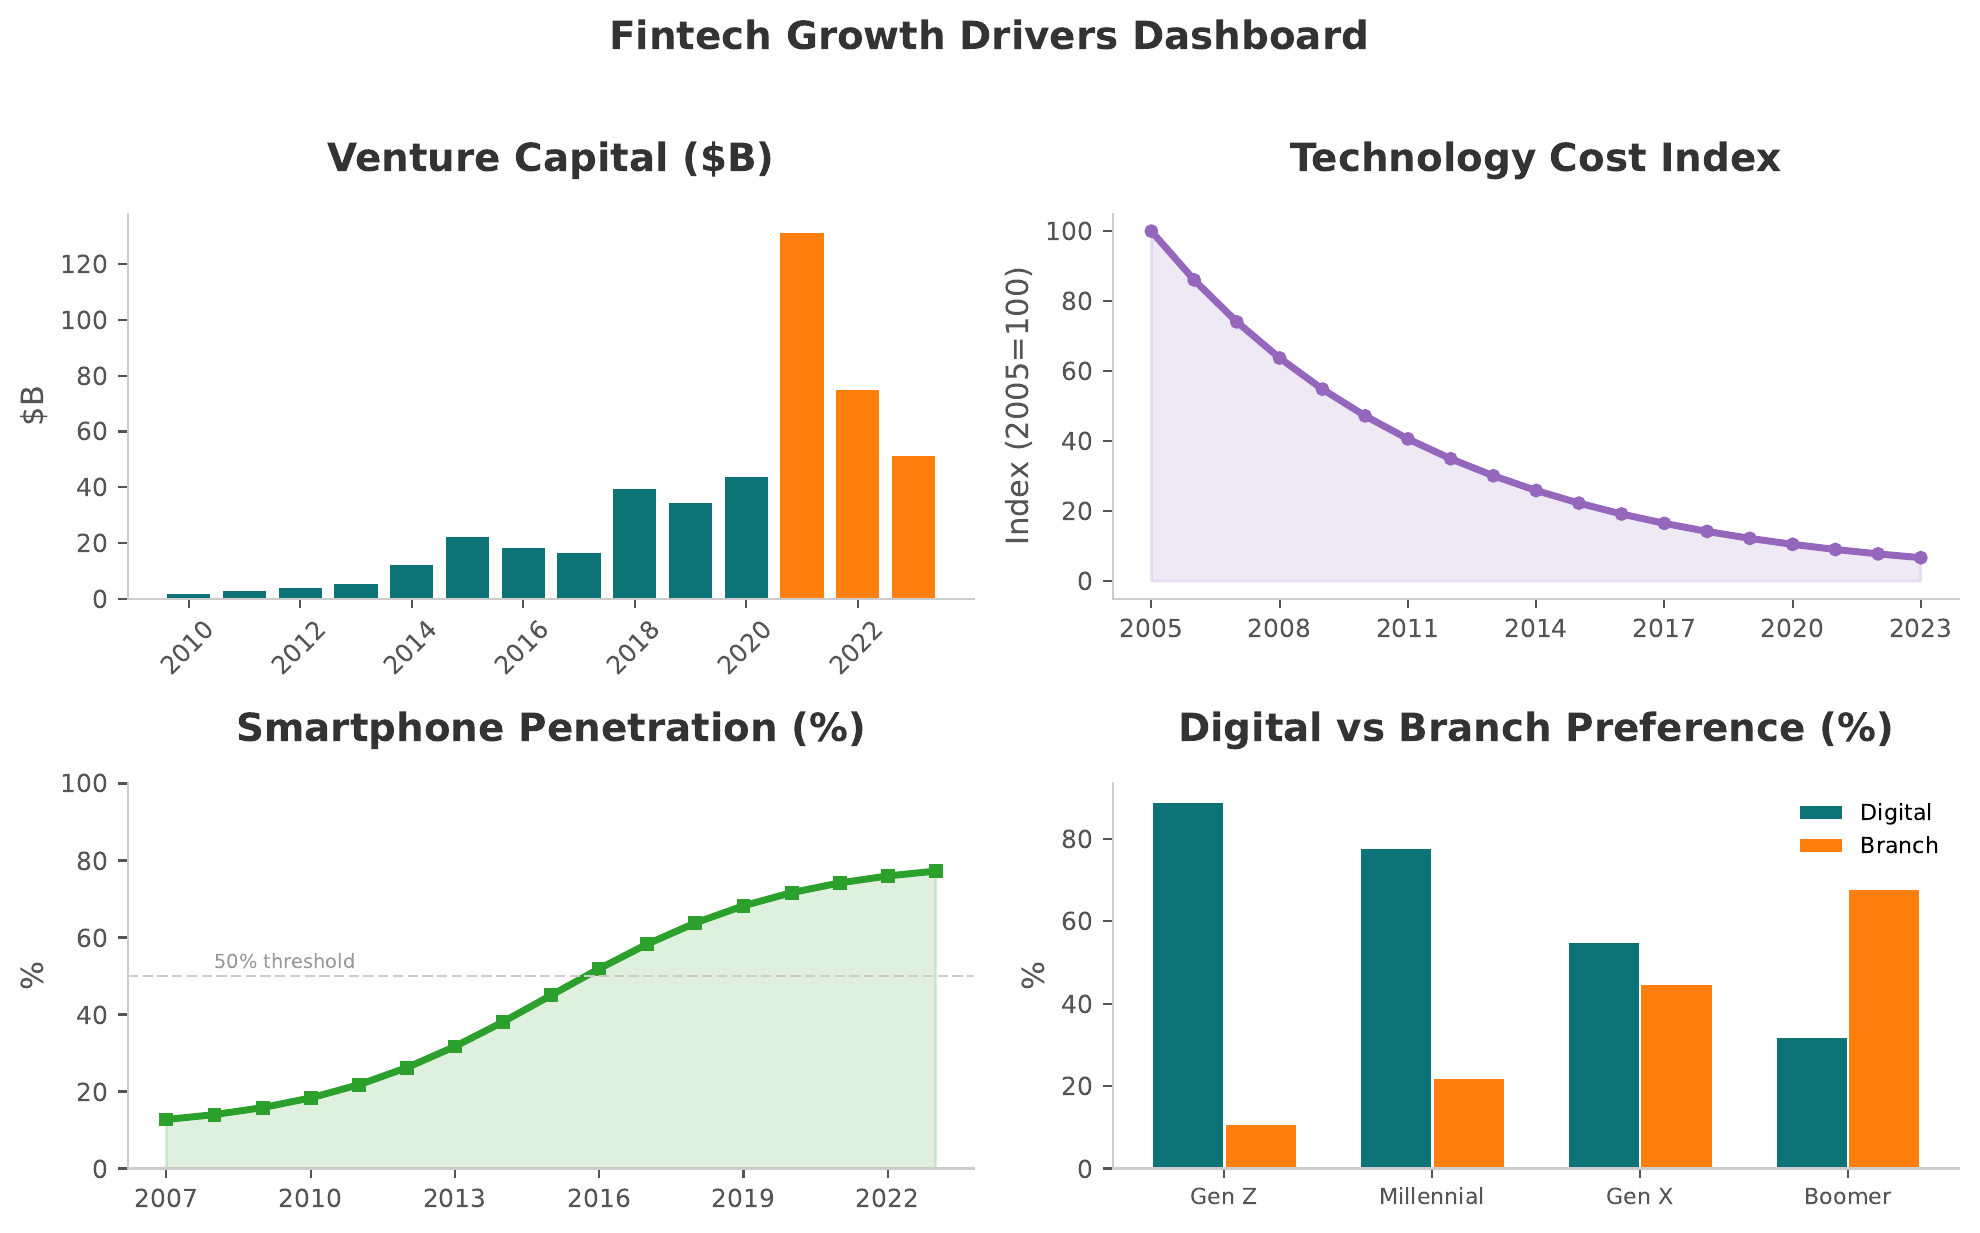
Four forces sustain fintech's growth trajectory:
- Capital — Venture funding, corporate venture arms, public market appetite. Global fintech VC investment grew from approximately USD 4B in 2013 to over USD 50B by 2021 before correcting.
- Technology — Cloud, APIs, AI/ML, biometric authentication. Each wave of technology reduces the cost of building financial products.
- Distribution — Smartphones, app stores, social media virality. Ubiquitous mobile devices create the distribution channel that branch networks never could.
- Demand — Trust erosion in incumbents, digital-native expectations, unbanked populations. The question is not "Why is fintech growing?" but "Why did it take so long to start?"
The question is not "Why is fintech growing?" but "Why did it take so long to start?" The four drivers had to converge simultaneously — capital without technology is useless; technology without demand is a solution looking for a problem.
Economic Benefits of Fintech
Fintech delivers measurable economic value across five dimensions:
- Cost reduction through automation — Digital onboarding, automated underwriting, and algorithmic compliance reduce operating costs by orders of magnitude. Neobank cost-to-income ratios can be 30–40%, compared with 55–70% at traditional banks.
- Improved credit access — Alternative data scoring (mobile usage, utility payments, social data) extends credit to populations invisible to traditional bureaus.
- Faster time-to-market — API-first architectures let new products launch in weeks, not years.
- Market efficiency — Real-time pricing, transparent fee structures, and reduced information asymmetry.
- New market creation — Micro-insurance, micro-investing, and fractional ownership create markets that did not previously exist.
Fintech's economic contribution is not just making existing services cheaper — it is making previously impossible services possible.
Financial Inclusion — The Unbanked Challenge
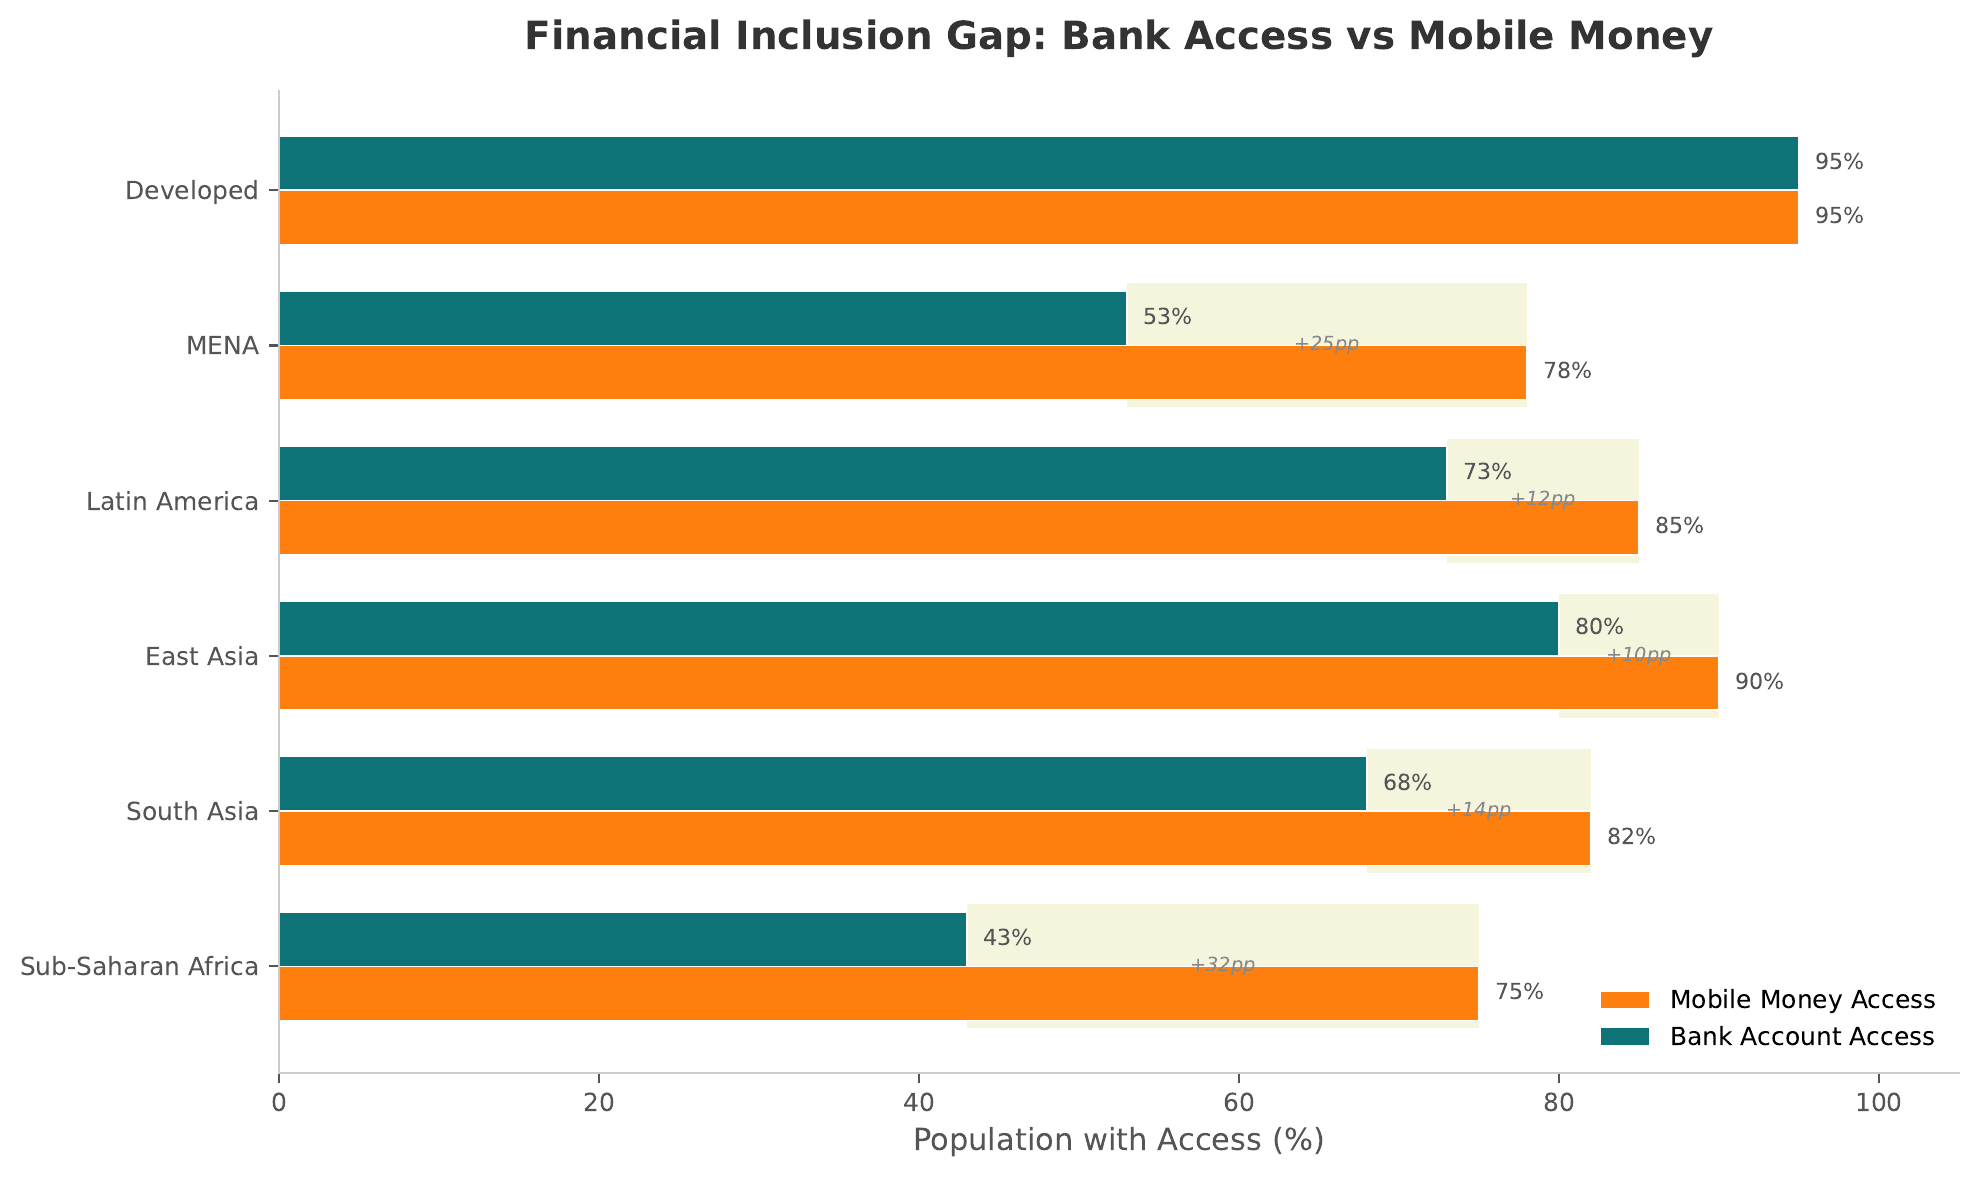
- The gap: 1.7 billion adults lack access to formal financial services. Two-thirds of them are women. Most live in Sub-Saharan Africa and South Asia.
- The paradox: Mobile phone penetration exceeds bank account penetration in nearly every developing economy — connectivity exists, but financial access does not.
- The behavioral layer: Even where access exists, trust deficits, financial illiteracy, and cultural norms suppress adoption.
Providing a product is not the same as achieving inclusion. People must also trust it, understand it, and choose to use it. World Bank Global Findex (2021): account ownership rose to 76% of adults globally, up from 51% in 2011.
M-Pesa — The Canonical Inclusion Story
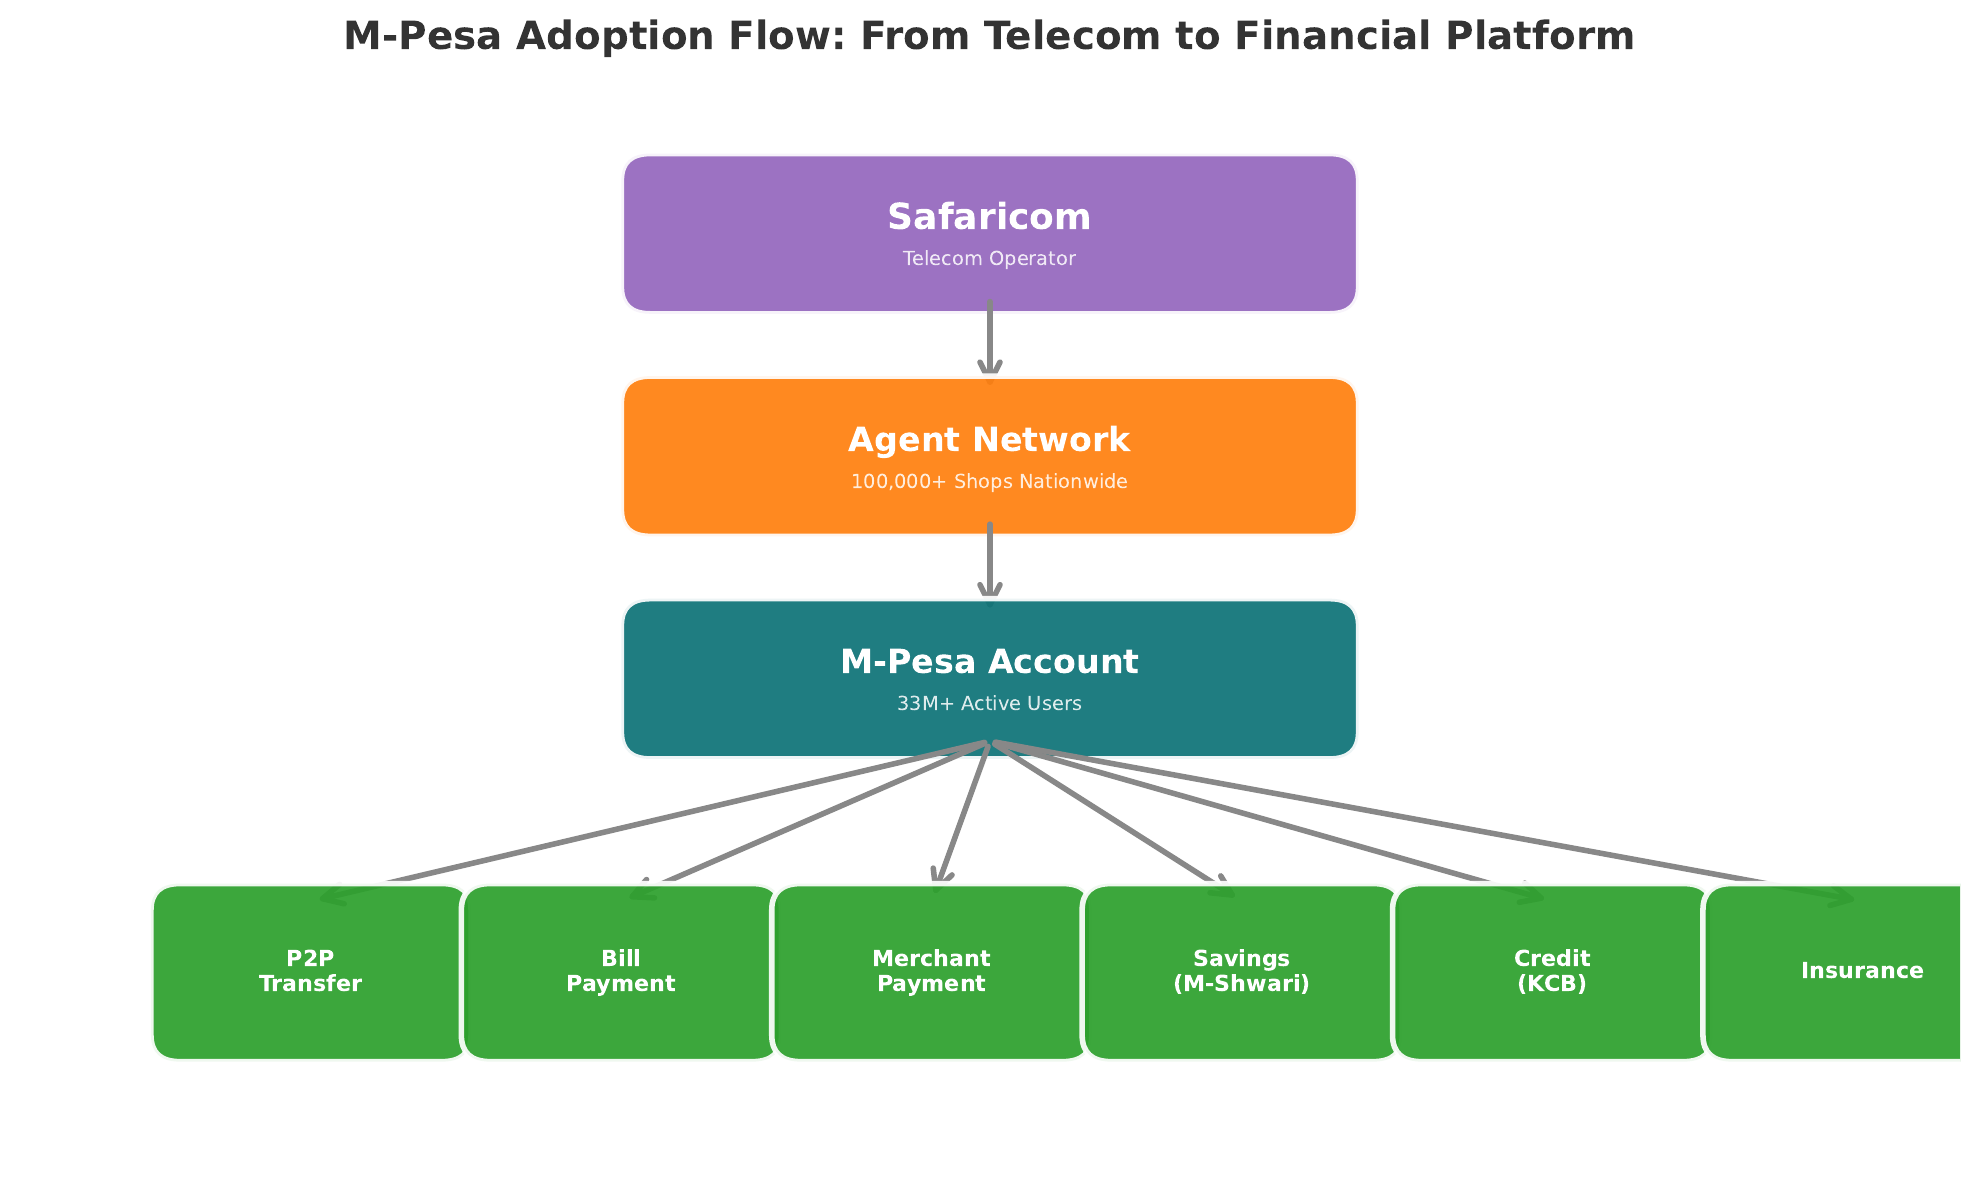
M-Pesa launched in Kenya in 2007 — not as a bank, but as a mobile money transfer service.
- Over 30 million active customers in Kenya alone
- 170,000+ agent locations (vs. fewer than 2,000 bank branches)
- No bank account required — just a SIM card
- Built on trust in the agent network, not trust in banks
M-Pesa did not digitize banking. It invented a new category: mobile money. This distinction matters — inclusion does not require making people use banks; it requires giving them financial tools that fit their context.
Trust and Adoption Dynamics
Frames 10–13 · Trust Framework, Behavioral Barriers, Adoption Lifecycle, DemographicsTrust in Financial Services — A Framework
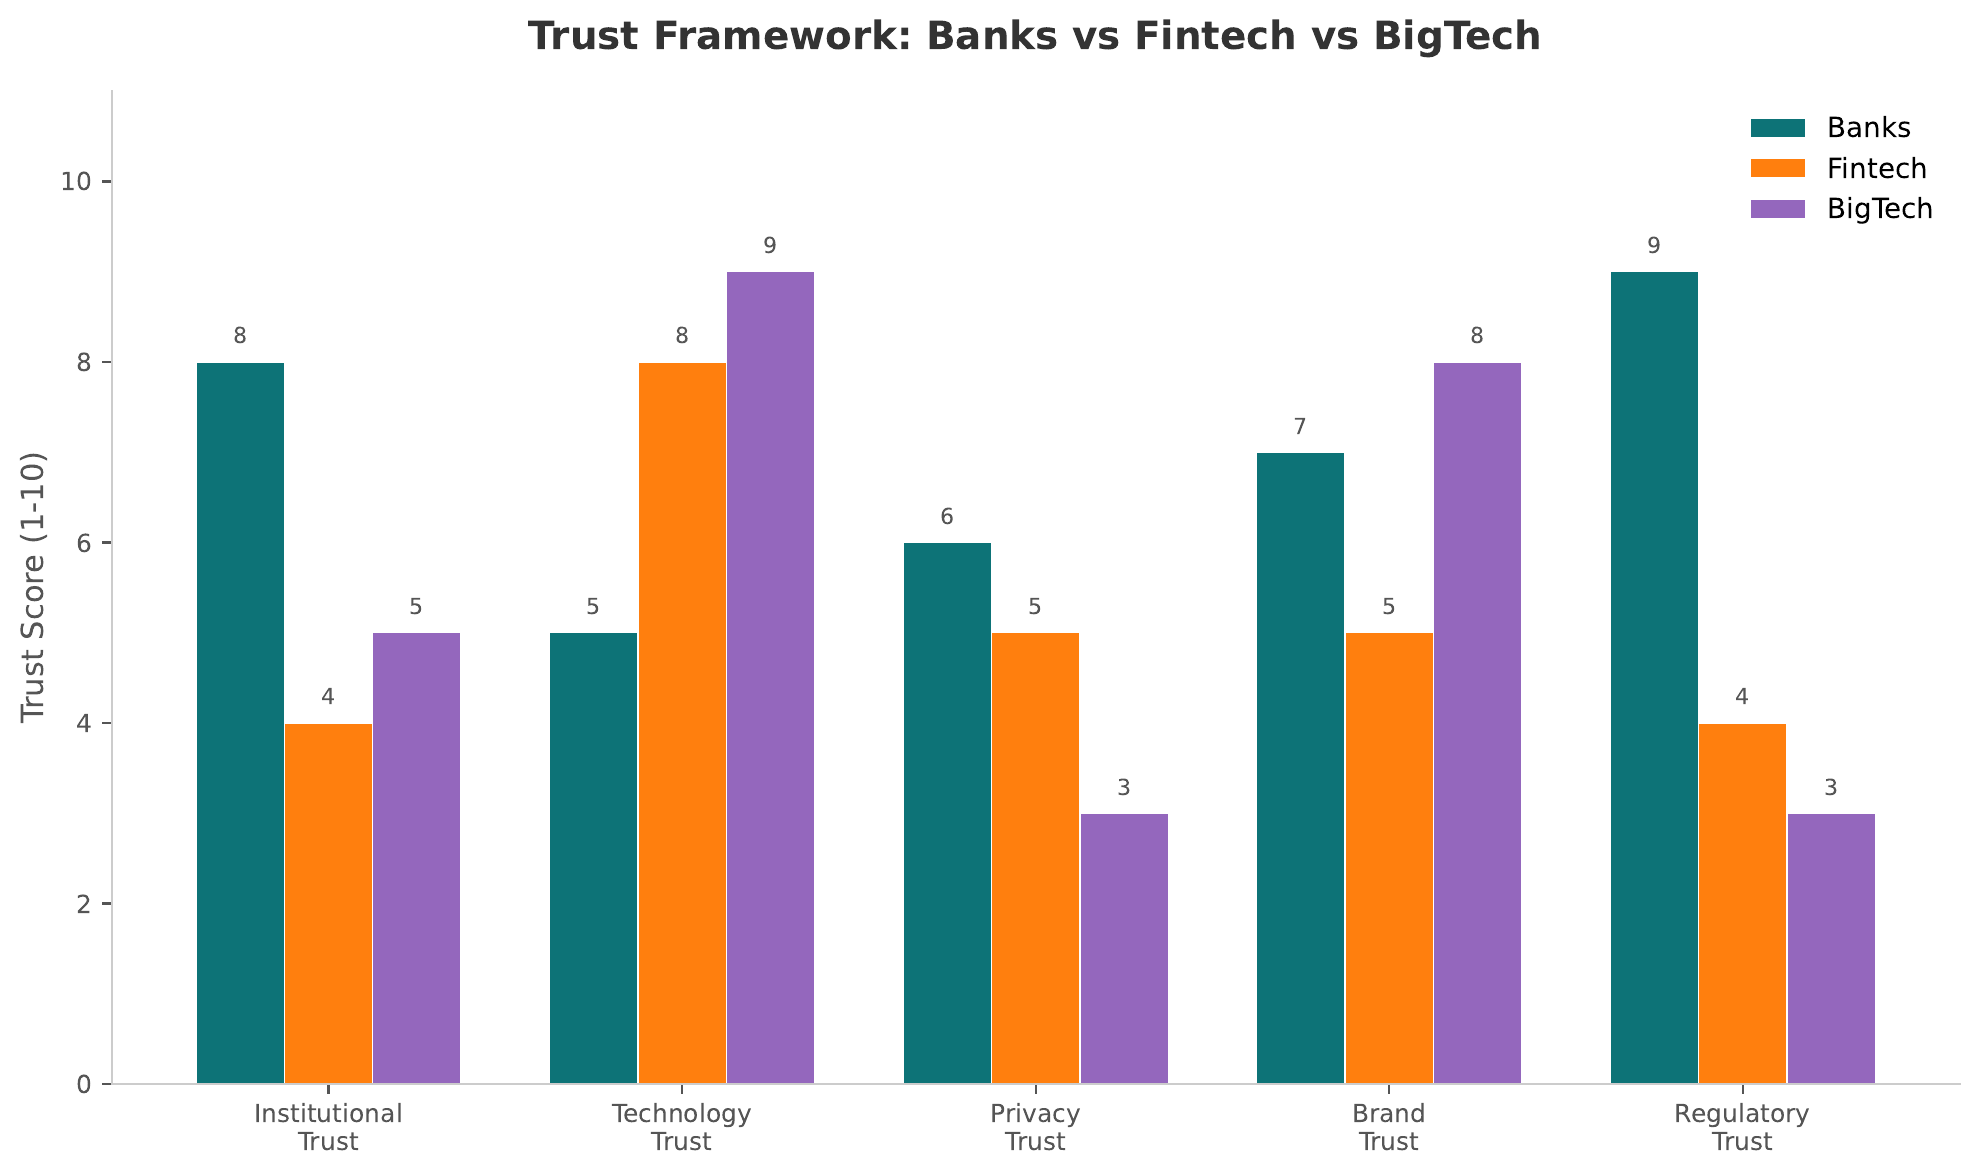
- Trust is multidimensional: Competence trust ("Can they do it?"), benevolence trust ("Do they care about me?"), and integrity trust ("Will they be fair?") operate independently.
- Provider differences: Banks score high on competence but low on benevolence. Fintechs score high on convenience but low on integrity (because they are new and untested).
- Building strategies: Banks emphasize stability and insurance. Fintechs emphasize transparency, UX quality, and peer endorsement.
The distinction between calculative trust (rational cost-benefit) and relational trust (emotional bond) explains why switching is hard. Consumers do not switch providers based on features alone — they switch when trust in the old provider breaks or trust in the new one is built through social proof.
Why People Resist New Financial Technology
The biggest competitor for any fintech product is not another fintech. It is the user's current behavior. Five behavioral barriers explain most non-adoption:
- Status quo bias — "My current bank is fine." The default always has an advantage.
- Loss aversion — The pain of a potential loss (data breach, lost funds) outweighs the gain of better features.
- Ambiguity aversion — Unknown risks feel worse than known risks. "At least I know what my bank will do."
- Social proof dependency — "Nobody I know uses it yet." Adoption requires visible peers.
- Complexity aversion — If onboarding takes more than three minutes, most people quit.
The biggest competitor for any fintech product is not another fintech. It is the user's current behavior. Kahneman and Tversky's prospect theory (1979) established that losses loom roughly twice as large as equivalent gains.
The Technology Adoption Lifecycle Applied to Fintech
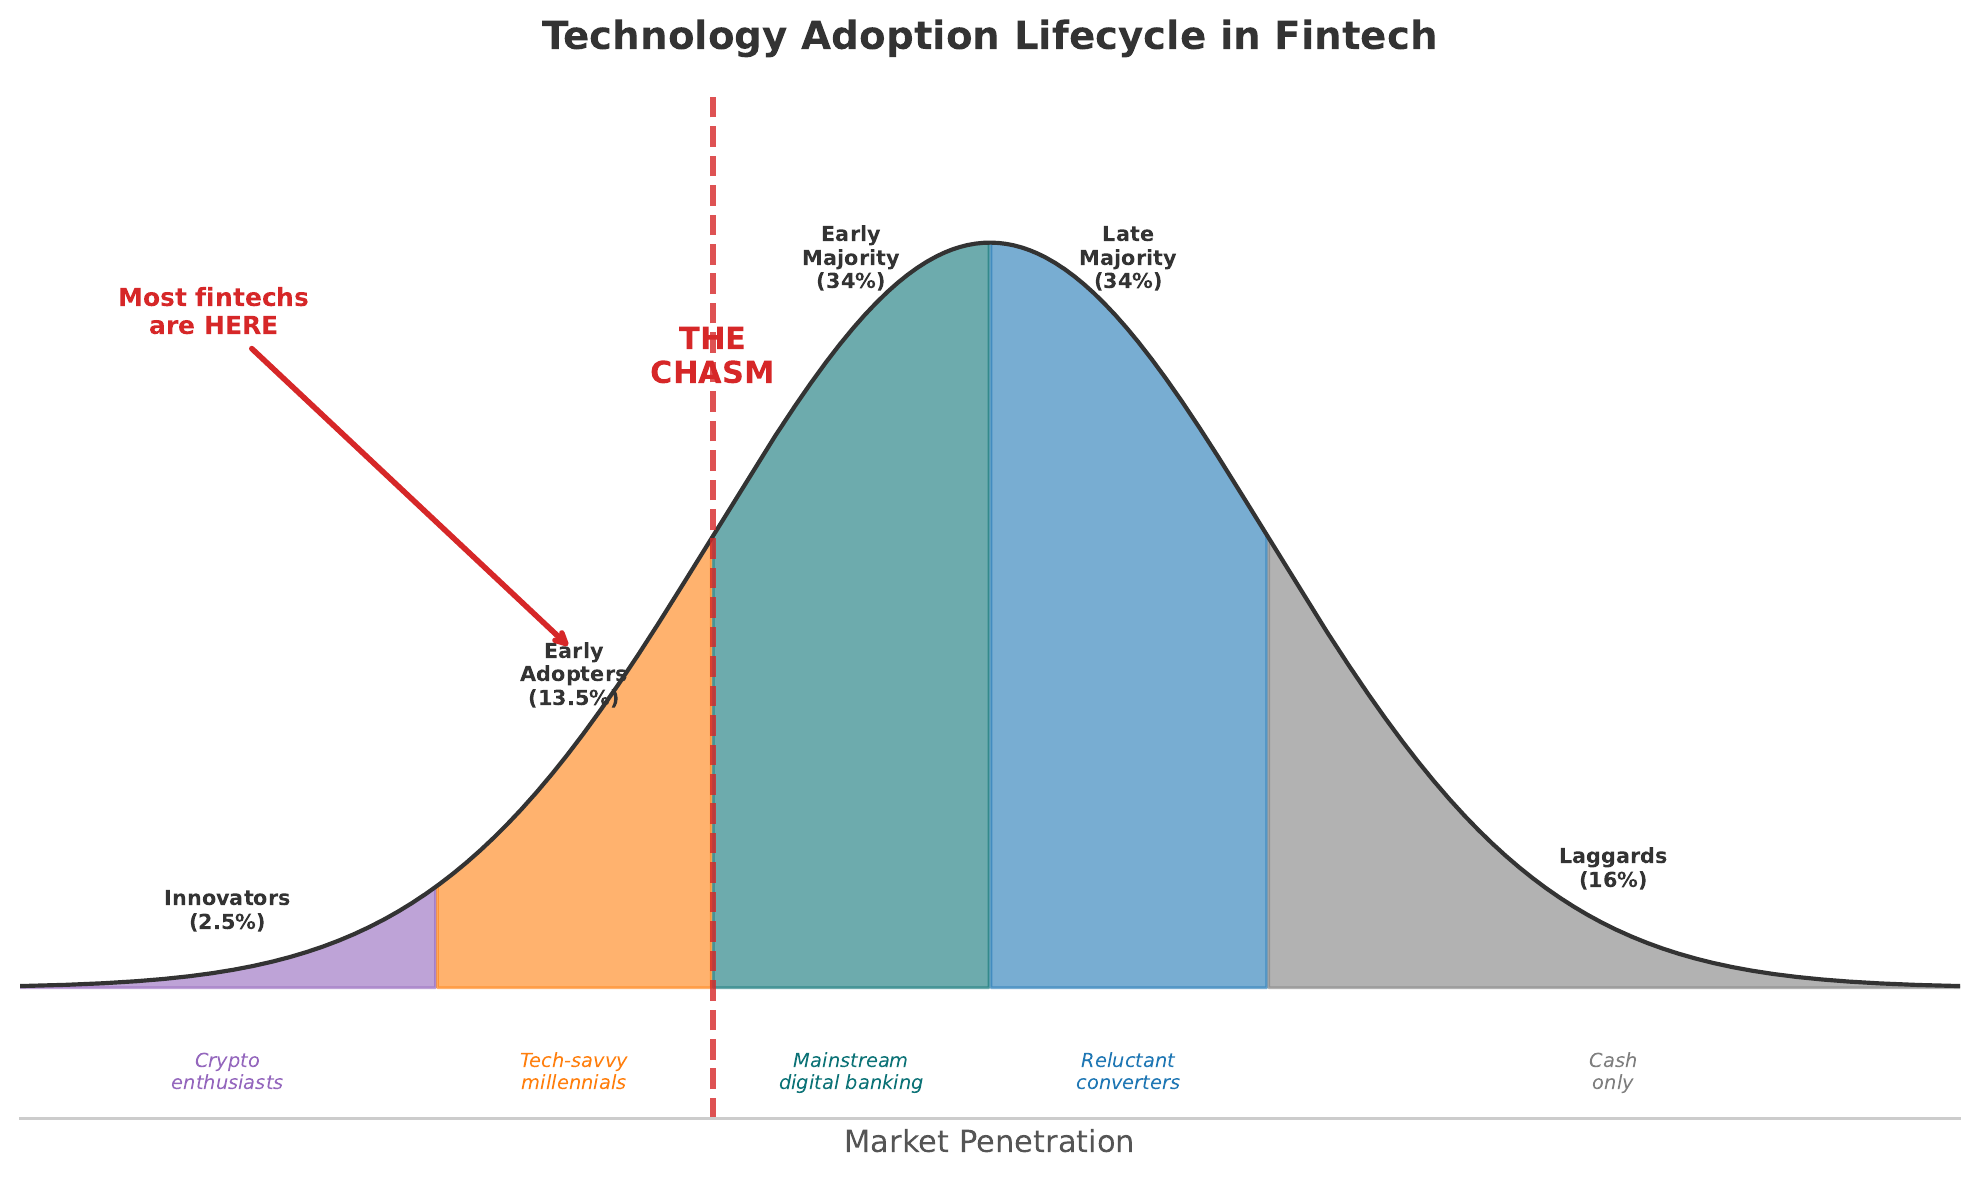
- Innovators (2.5%) — Crypto early miners, DeFi experimenters. Motivated by novelty.
- Early Adopters (13.5%) — Neobank first users. Motivated by advantage over incumbents.
- Early Majority (34%) — Mainstream mobile banking users. Need social proof and low friction.
- Late Majority (34%) — Adopt only when the old option disappears. Need institutional endorsement.
- Laggards (16%) — Cash-only, branch-dependent. Adopt only under duress.
The gap between Early Adopters and Early Majority — Geoffrey Moore's "chasm" — is where most fintech products die. Crossing it requires trust, not just features. Moore's Crossing the Chasm (1991) explains why many technically superior products fail commercially.
Risk Aversion Across Demographics
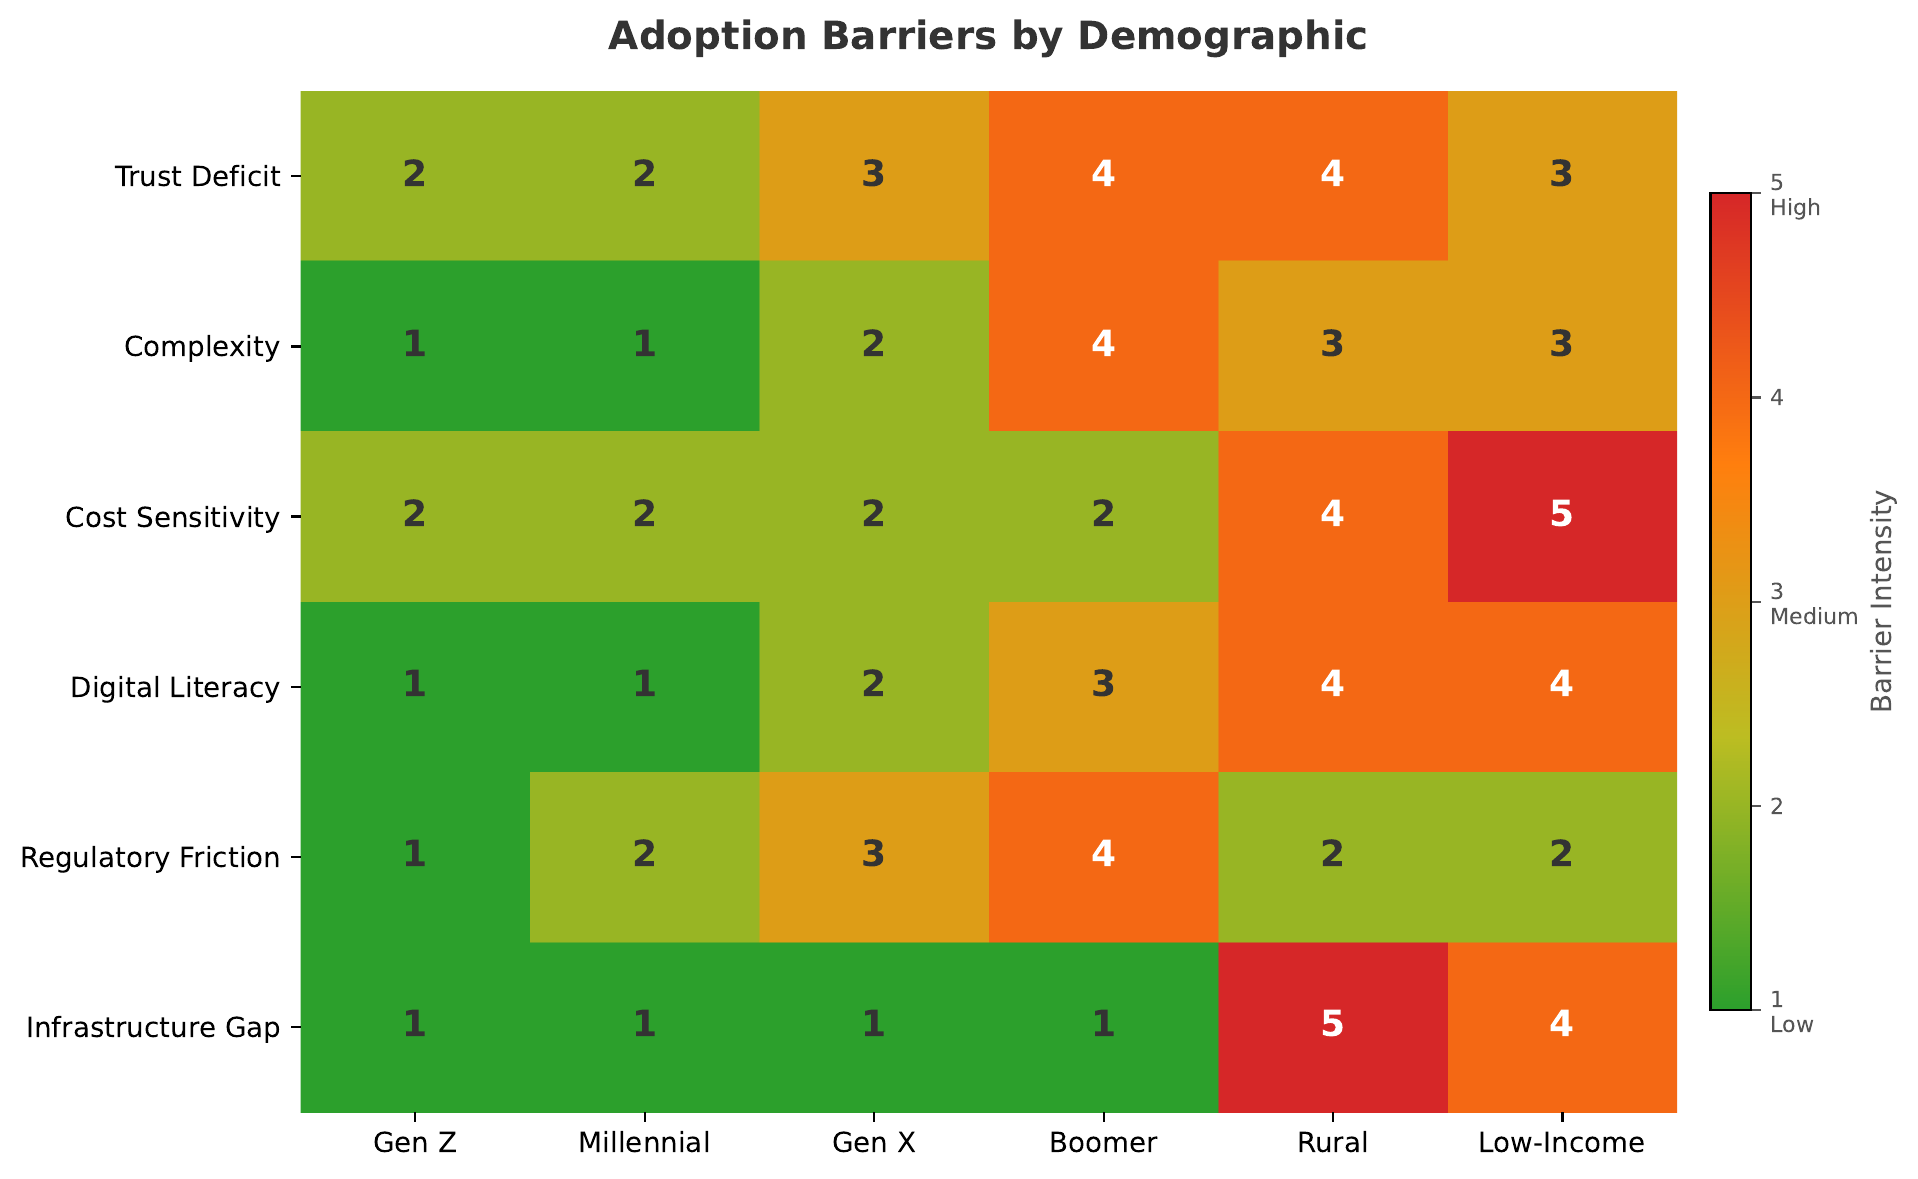
- Age: Older adults show higher aversion to digital-only providers. Trust in physical branches remains strong.
- Income: Low-income users face higher stakes per transaction. A single error matters more.
- Geography: Urban populations adopt faster due to network effects and peer visibility.
- Digital literacy: Smartphone ownership alone does not predict adoption. Comfort with digital interfaces does.
One-size-fits-all fintech design systematically excludes the most vulnerable users. Inclusive design must account for age, income, geography, and digital literacy — not just smartphone ownership.
Choice Architecture and Nudging
Frames 14–17 · Choice Architecture, Five Nudges, Dark Patterns, Ethical DesignChoice Architecture — Designing Financial Decisions
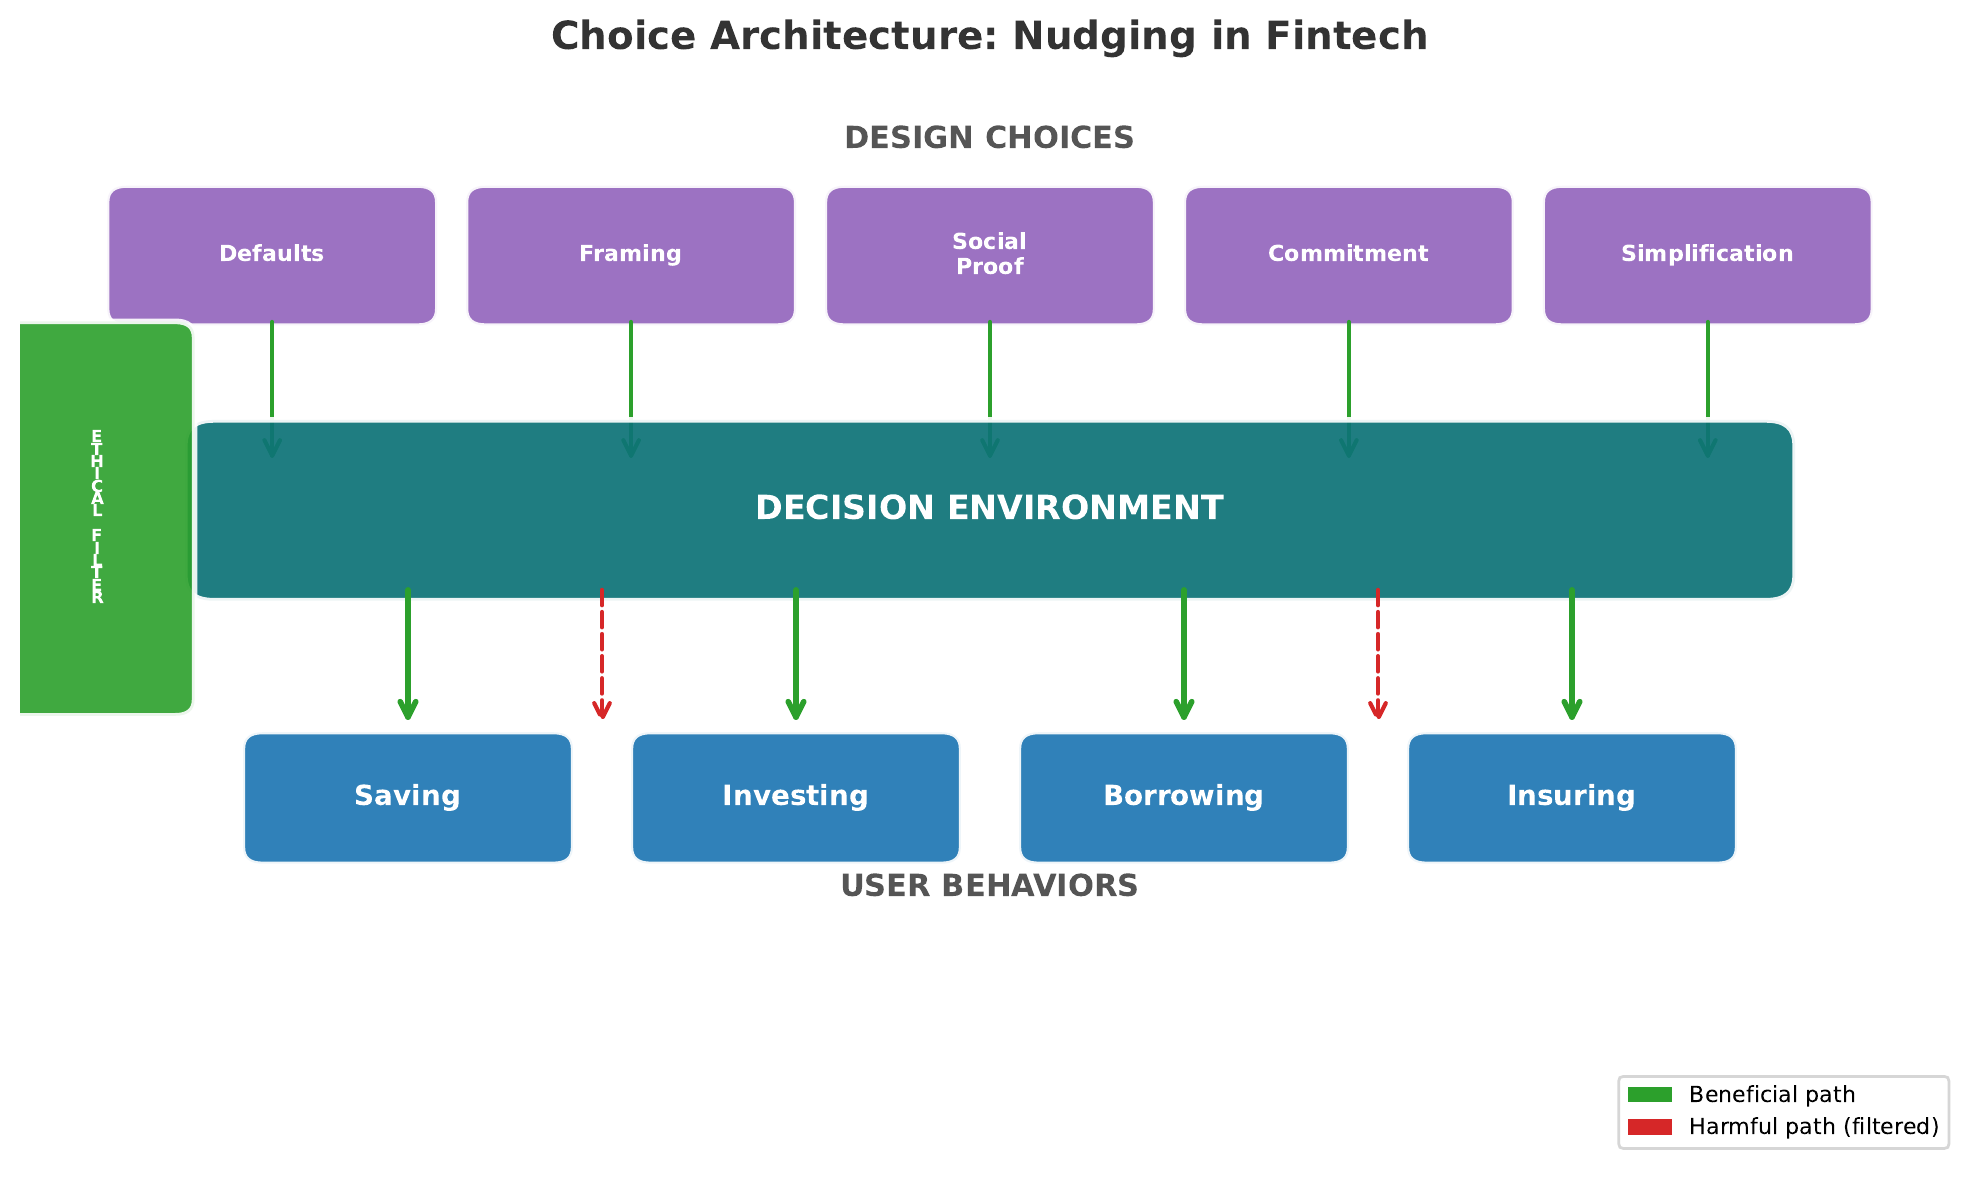
- Every financial interface is a designed environment. Screen layout, button placement, default selections, and information ordering all influence decisions.
- There is no neutral design. Presenting three investment options or thirty is a choice. Showing returns before fees or after fees is a choice. Every design decision is a nudge.
- Fintech is choice architecture. Unlike a bank branch, where a human advisor mediates decisions, a fintech app is the decision environment.
In fintech, the product designer has more influence over financial decisions than the financial advisor ever did. Thaler and Sunstein's Nudge (2008) is the foundational text for understanding this power.
Five Nudges That Shape Financial Behavior
- Default settings — Auto-enrollment in savings plans increases participation from approximately 40% (opt-in) to over 90% (opt-out). The default is the decision for most people.
- Framing effects — "You pay CHF 47 per month" vs. "This costs 3.2% of your portfolio." Same fact, different decisions.
- Social proof — "87% of users your age have started saving." Peer comparison is the most powerful motivator for financial behavior change.
- Commitment devices — Savings lock-ups, goal-setting features, and voluntary restrictions exploit the gap between present and future selves.
- Simplification — Reducing choices from 40 options to 3 increases decision quality and completion rates.
Each nudge is a tool. Tools can build houses or break them. Madrian and Shea (2001): automatic enrollment in 401(k) plans raised participation from 49% to 86% — the canonical nudge study.
Dark Patterns — When Nudging Goes Wrong
Five dark patterns common in financial apps:
- Hidden fees — Costs buried in scrollable terms, revealed only at checkout.
- Confirm-shaming — "No thanks, I don't want to save money." Guilt-driven opt-out language.
- Roach motel — Easy to sign up, deliberately difficult to close an account or cancel.
- Urgency manipulation — "Only 2 hours left!" applied to investment decisions.
- Default opt-in — Pre-checked boxes for premium services, overdraft "protection," data sharing.
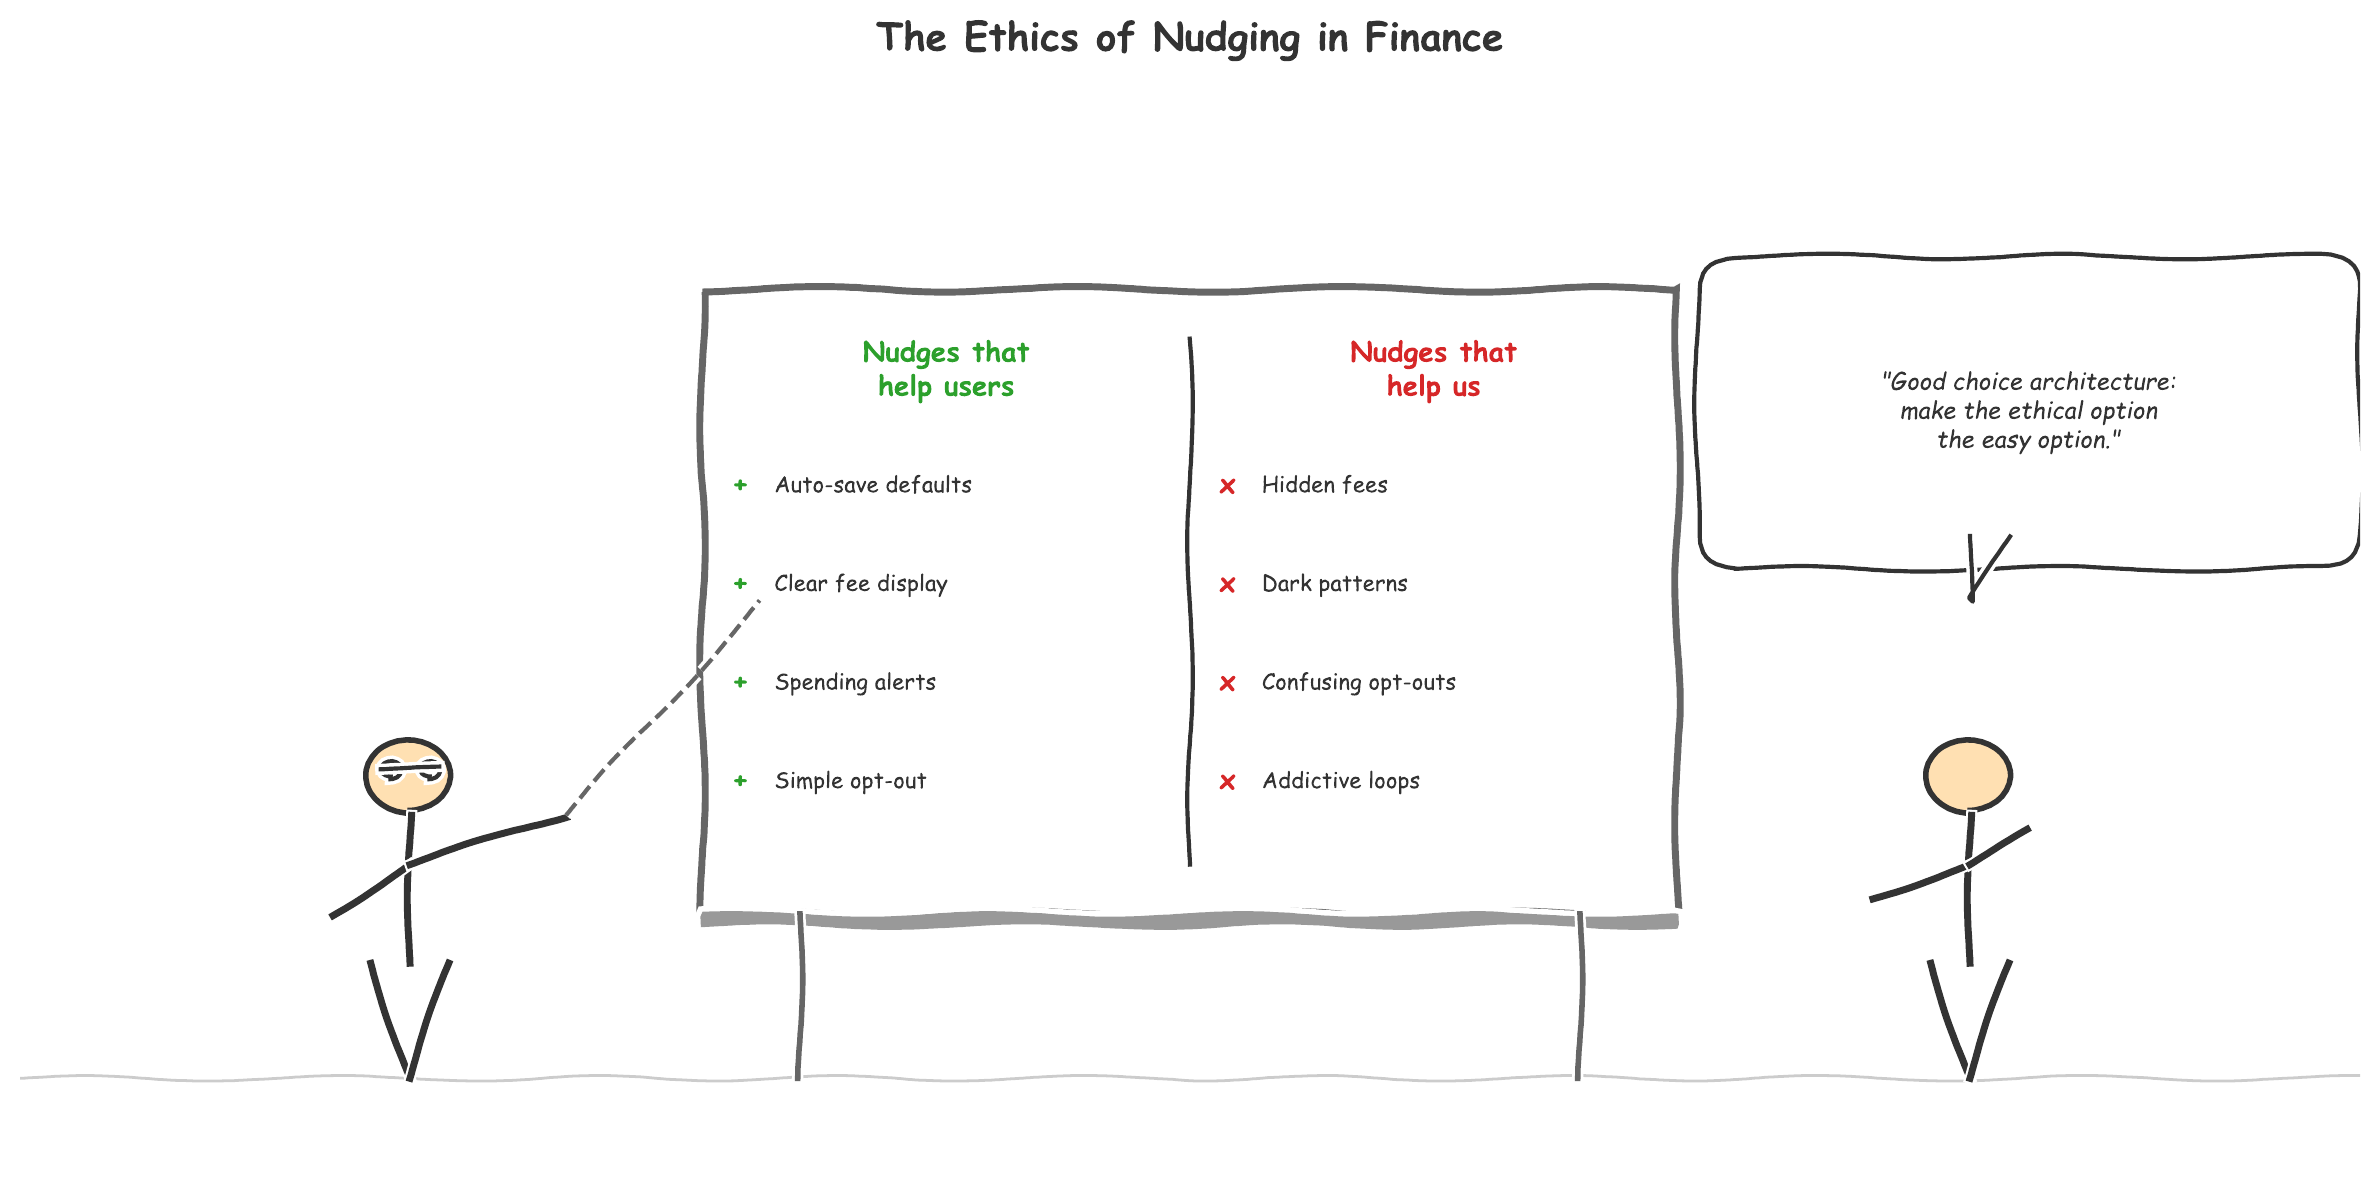
Aligned with the user's interest. Helps users save more, spend wisely, or make informed decisions. Transparent and reversible.
Aligned with the company's revenue. Tricks users into spending, obscures costs, or makes exit difficult. Opaque and irreversible.
Dark patterns erode the trust that fintech needs to cross the adoption chasm. The EU Digital Services Act (2022) and proposed AI Act explicitly target manipulative design patterns in digital services.
Ethical Choice Architecture — A Design Checklist
Five principles for ethical choice architecture:
- Transparency — Users can see that they are being nudged and how.
- Reversibility — Every default can be changed. Every choice can be undone.
- Alignment — The nudge serves the user's stated goals, not the company's revenue targets.
- Disclosure — Conflicts of interest are visible. Referral fees, commissions, and incentives are shown.
- Optionality — Users always have a clear path to "none of the above."
"Could you defend this design choice on the front page of a newspaper?" If the answer is no — or if you hesitate — the nudge has crossed from architecture into manipulation. Fintech companies have a unique design responsibility: they are simultaneously the advisor, the product, and the environment in which financial decisions occur.
Risks and Paradoxes
Frames 18–20 · Inclusion Paradox, Trust Fragility, Manipulation at ScaleThe Financial Inclusion Paradox
Financial inclusion through fintech creates four categories of risk:
- Digital divide — Inclusion assumes connectivity, smartphones, and digital literacy. Those without them are excluded more as physical infrastructure closes.
- Predatory inclusion — Giving people access to credit they cannot manage is not inclusion. Digital lending at 100%+ APR to vulnerable populations is extraction.
- Over-indebtedness — Frictionless borrowing removes the "cooling off" period that friction once provided. Instant access means instant debt.
- Data exploitation — Alternative credit scoring uses personal data in ways consumers neither understand nor consent to meaningfully.
Financial inclusion without consumer protection is not inclusion — it is exploitation with better distribution. M-Shwari (Kenya) demonstrated both inclusion and risk: default rates exceeded 20% within two years of launch.
Trust Fragility in Digital Finance
Digital trust is asymmetric: it takes years to build and seconds to destroy. Unlike a branch bank, where trust is mediated by a human relationship, a fintech's trust rests entirely on:
- App reliability
- Transparent communication
- Brand reputation
- Regulatory endorsement
Four factors amplify trust fragility in digital finance:
- No physical presence — No branch to visit when something goes wrong.
- Deposit insurance gaps — Many fintechs hold funds outside traditional insurance schemes.
- Viral reputation risk — A single outage or scandal spreads instantly on social media.
- Regulatory uncertainty — Licensing changes can make a legal product illegal overnight.
The speed of digital trust destruction exceeds the speed of digital trust construction by an order of magnitude. The SVB collapse (2023) demonstrated how social-media-amplified bank runs can destroy institutional trust in hours, not weeks.
Behavioral Manipulation at Scale
| Mechanism | Beneficial Use | Harmful Use |
|---|---|---|
| Defaults | Auto-save 10% | Auto-opt into overdraft |
| Framing | Show total cost | Hide fees in fine print |
| Social proof | "Peers save more" | "Everyone is buying crypto" |
| Urgency | Tax deadline reminder | "Offer expires in 5 min" |
| Simplification | 3 clear plans | Hide the free option |
Every nudging mechanism is dual-use. The same technique that helps one user save more helps another user overspend. Scale amplifies both outcomes: a dark pattern in an app with 50 million users causes 50 million instances of harm.
"The ethical question is not whether to nudge — it is whom the nudge serves."
Evidence at Scale
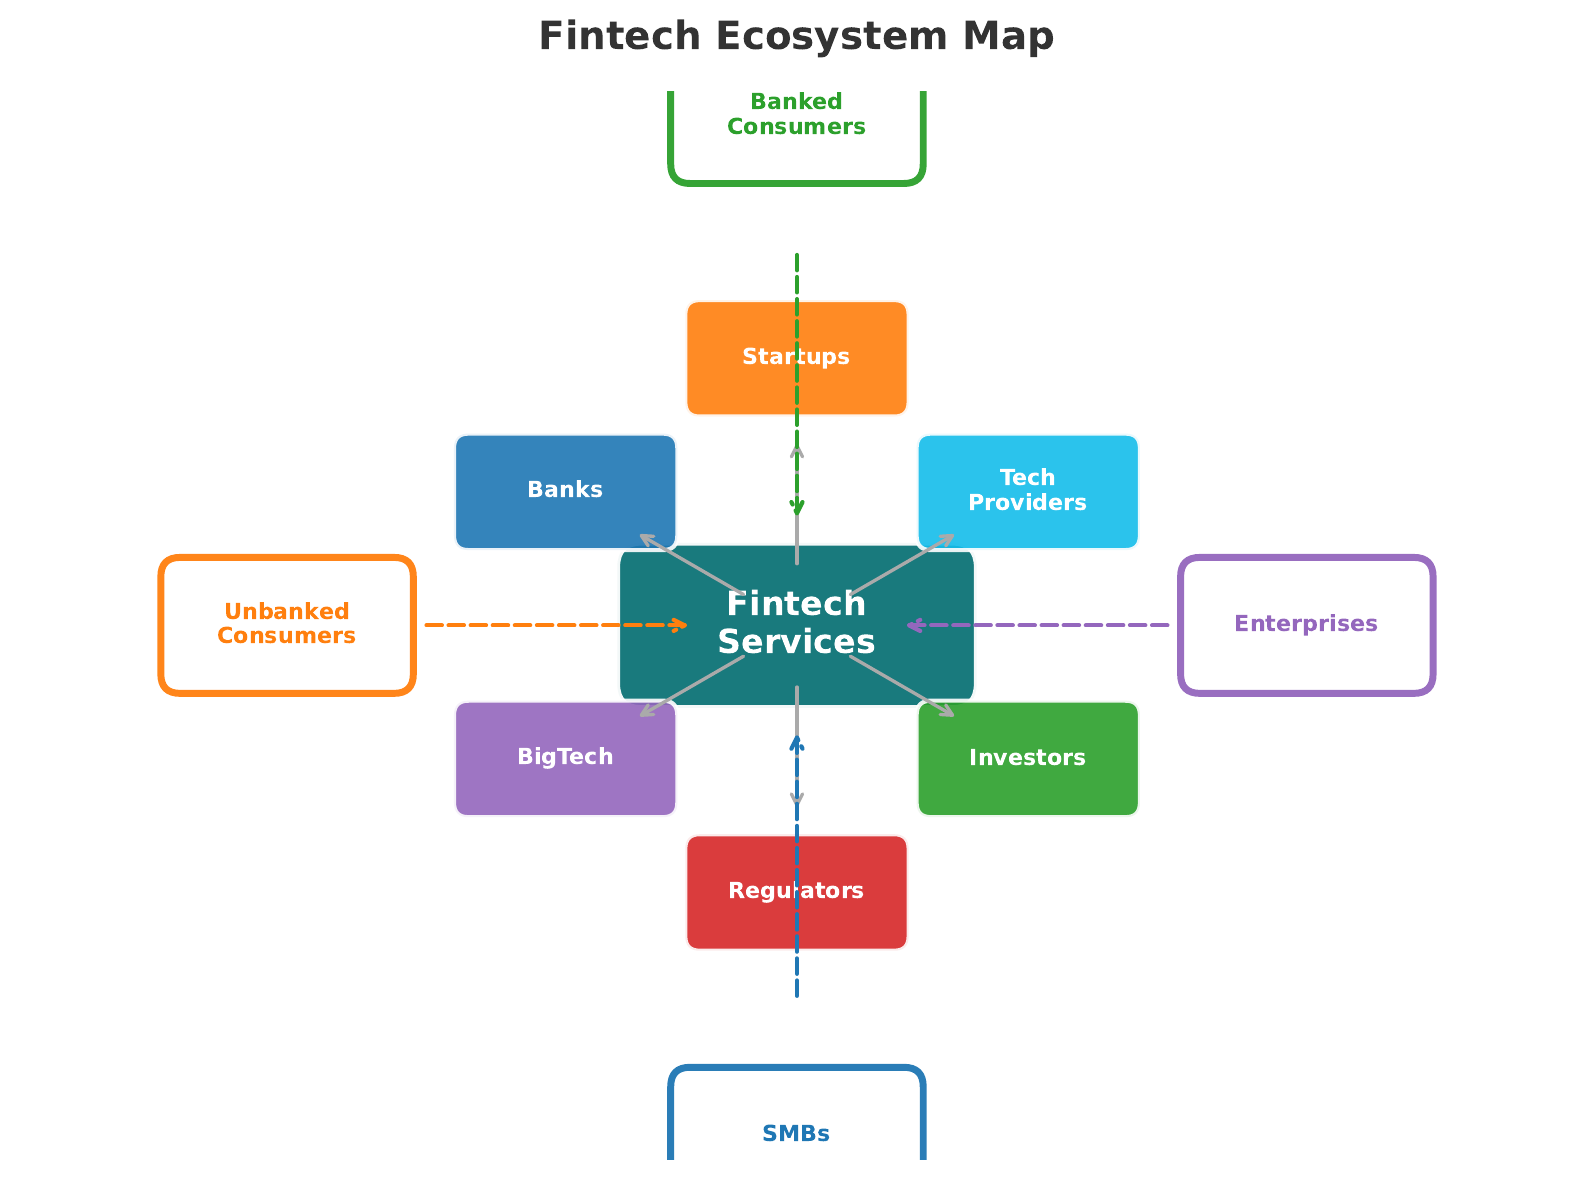
Frames 21–23 · Stakeholder Map, Success & Failure Stories, National-Scale NudgingFintech Ecosystem Stakeholder Map
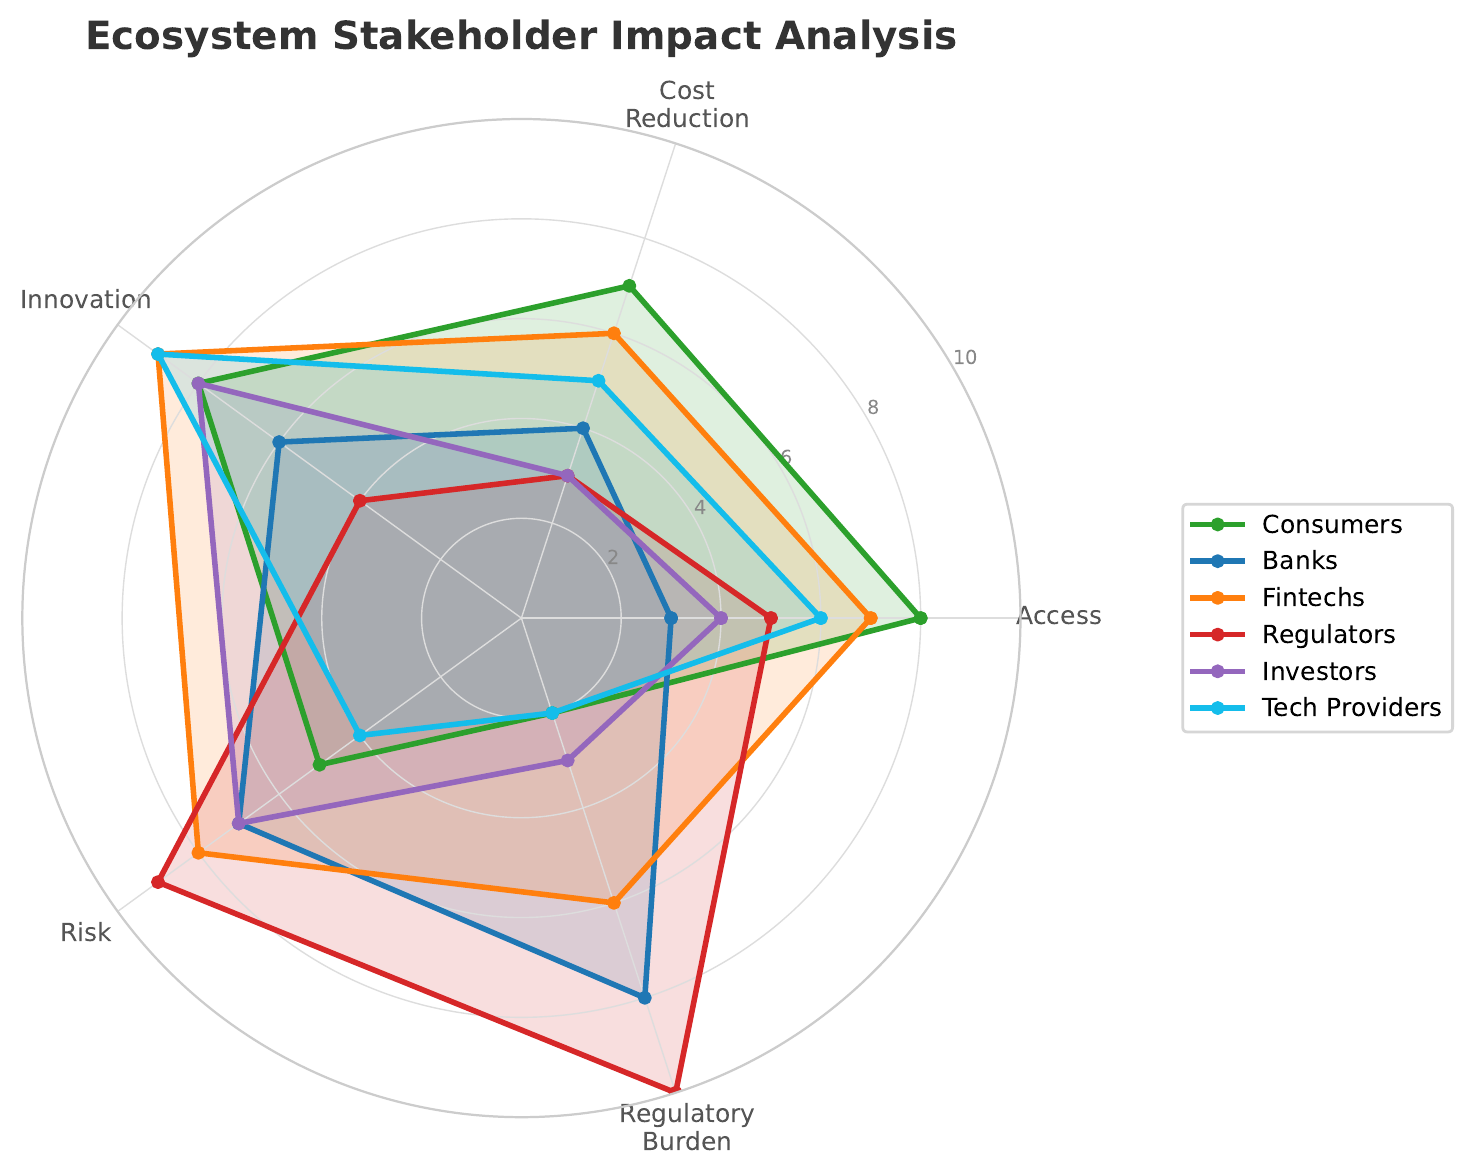
The fintech ecosystem is not bilateral (bank vs. fintech). It is a multi-stakeholder system:
- Asymmetric effects: What benefits consumers (lower fees) hurts bank revenue. What helps regulators (transparency) raises compliance costs. No policy is universally positive.
- Interconnected risks: A fintech failure does not only affect its customers — it cascades through partners, investors, and the regulatory ecosystem.
- Design externalities: A single app's choice architecture sets behavioral norms across the industry.
Financial Inclusion — Success Stories and Cautionary Tales
- M-Pesa (Kenya) — Mobile money for 30M+ users without bank accounts
- PIX (Brazil) — Instant payments reaching 140M+ users in two years, government-driven
- Jan Dhan Yojana (India) — 500M+ bank accounts opened via national campaign + Aadhaar ID
- GCash (Philippines) — Mobile wallet reaching rural populations via agent network
- Micro-lending traps — Apps offering instant loans at predatory rates in East Africa and South Asia
- Crypto inclusion narrative — "Banking the unbanked" claims masking speculative products
- Aadhaar exclusion — Biometric failures denying benefits to the most vulnerable
- Predatory BNPL — Buy-now-pay-later enabling debt spirals among young consumers
Every inclusion success shares three traits: local context awareness, trust infrastructure, and regulatory support. Every failure lacks at least one. Success and failure often coexist in the same market — Kenya has both M-Pesa (success) and predatory digital lending (failure).
Behavioral Nudging at National Scale
Lesson: Government can nudge at scale.
Lesson: Defaults are the most powerful nudge.
Lesson: Infrastructure is the ultimate nudge.
"When nudges are embedded in national infrastructure, they become invisible — and irresistible."
Inclusion-Protection Trade-off
Frames 24–25 · Quadrant Framework, Who Benefits MostThe Inclusion-Protection Trade-off — A Quadrant Framework
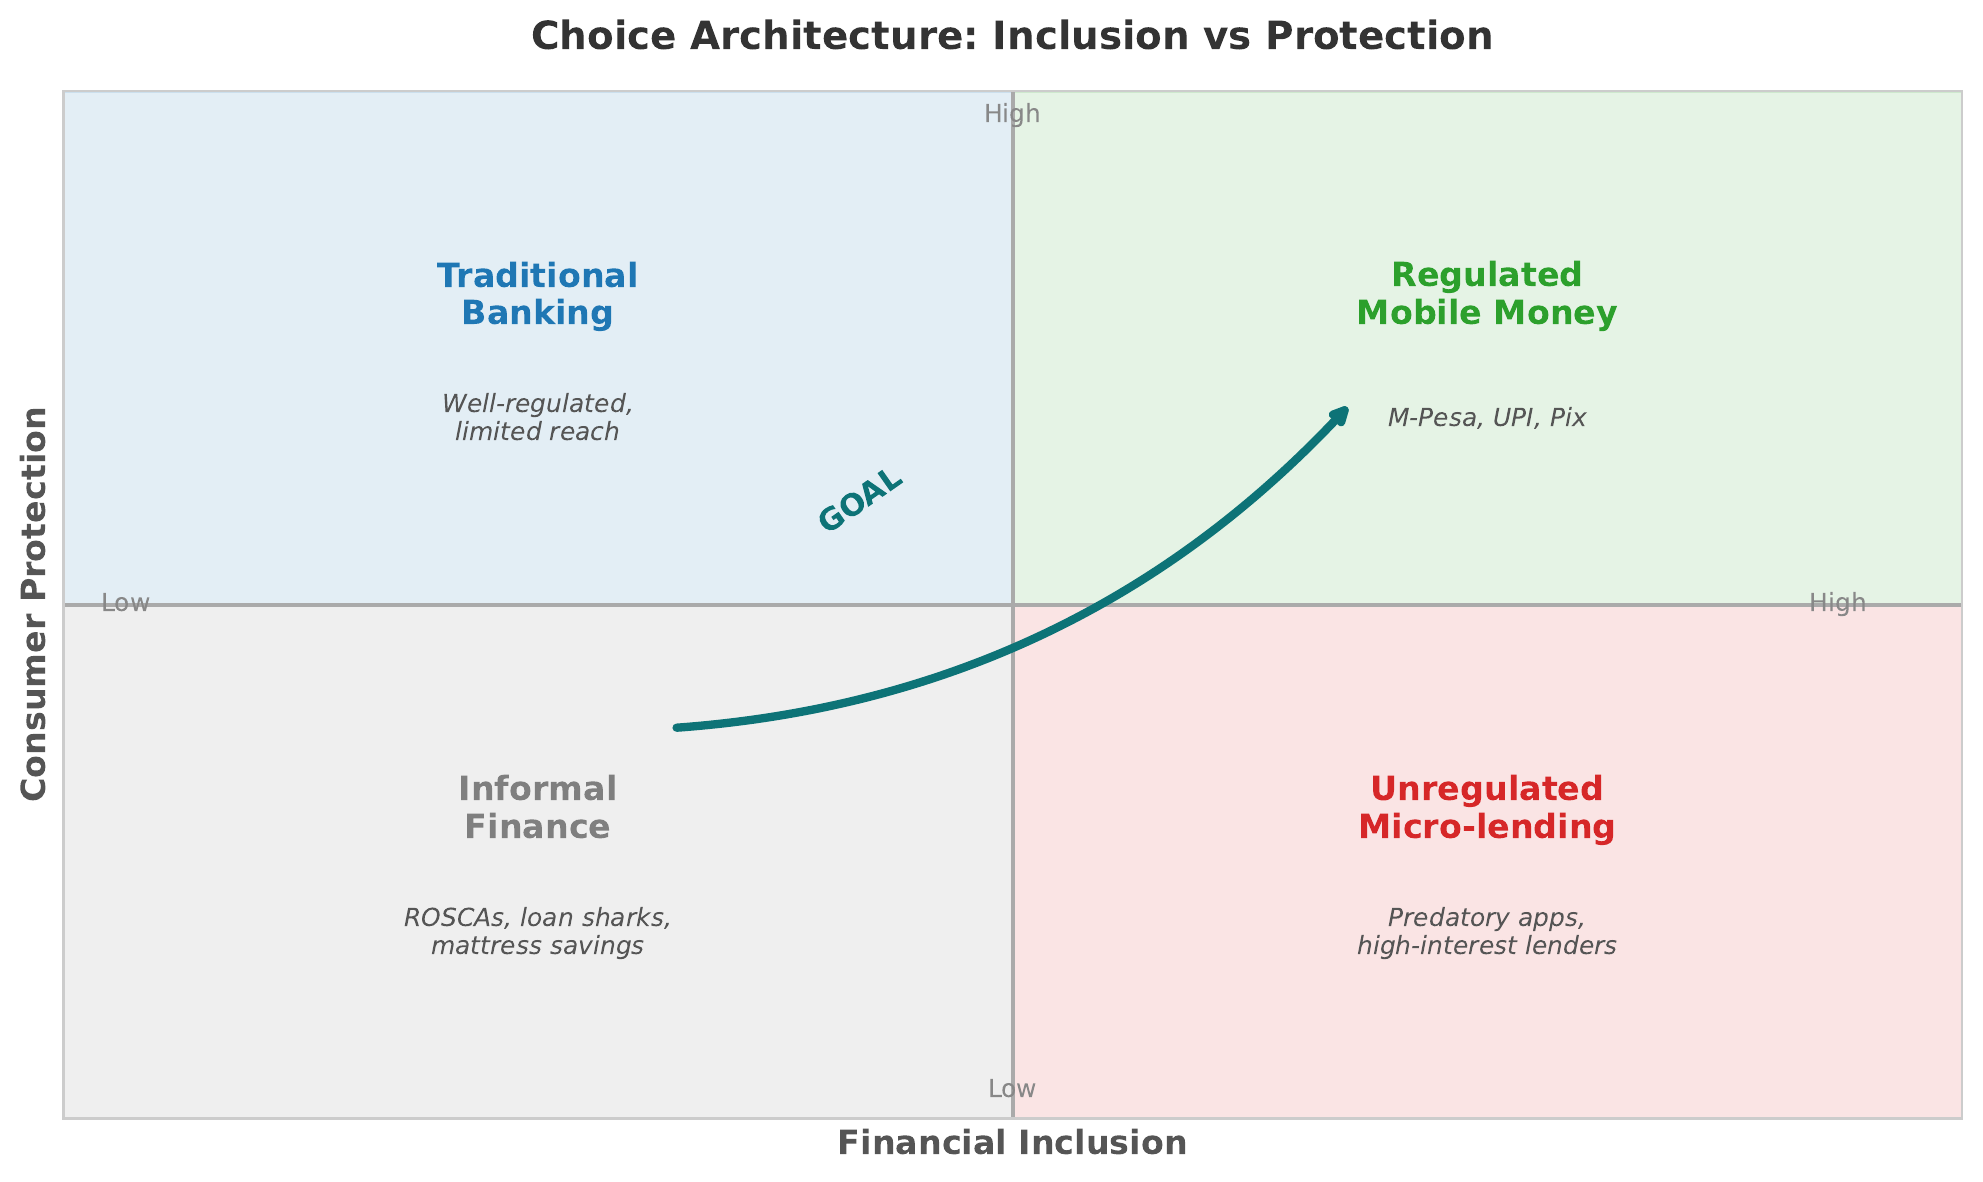
A quadrant framework for evaluating fintech outcomes:
| Quadrant | Description | Example |
|---|---|---|
| Q1: High inclusion, high protection | The gold standard. Access with safety nets. | M-Pesa with agent dispute resolution |
| Q2: High inclusion, low protection | Access without safety nets. | Predatory digital lending |
| Q3: Low inclusion, high protection | Safe but exclusionary. | Traditional banking |
| Q4: Low inclusion, low protection | The worst outcome. | Unregulated crypto in vulnerable markets |
Every fintech product sits in one of these quadrants. The goal is Q1. Most fintech currently sits in Q2 or Q3. Use this framework to evaluate any fintech initiative in Workshop C.
Who Benefits Most from Behavioral Fintech?
Behavioral fintech is not equally valuable to all users. Its benefits concentrate among populations with the most to gain from better decision environments:
- Low-income users: Auto-savings, spending alerts, and budgeting tools have disproportionate impact when margins are thin.
- Young adults: First-time financial decision-makers benefit most from guided defaults and simplification.
- Elderly users: Fraud detection, simplified interfaces, and proactive alerts protect against exploitation.
- Small businesses: Automated invoicing, cash flow forecasting, and simplified tax tools reduce administrative burden.
Behavioral fintech is a force multiplier: it amplifies good decisions for those who need the most help — but only if designed with their constraints in mind. The Robinhood/GameStop episode (2021) demonstrated that behavioral fintech can also amplify harmful decisions when gamification meets speculation.
Synthesis and Evaluation
Frames 26–27 · Ecosystem Evaluation Framework, Central Tension RevisitedAn Ecosystem Evaluation Framework — Five Questions
Extending L01's five-question strategic framework, ask five more questions that evaluate impact rather than strategy:
-
Who is excluded?
-
What behavioral assumptions does it make?
-
How does it nudge?
-
What happens when it fails?
-
Does it build or erode trust?
L01's framework evaluates strategy — whether a fintech can succeed as a business. L02's framework evaluates impact — whether a fintech should succeed as a product. A fintech product that passes L01's strategy test but fails L02's ecosystem test may be profitable but harmful. Apply both frameworks together in Workshop C.
The Central Tension Revisited
This lecture has circled a single tension:
Fintech has the tools to include the excluded, empower the underserved, and improve financial decisions at scale. But the same tools can exclude, exploit, and manipulate.
The difference is not the technology. The difference is the design choices — the defaults, the frames, the incentives, and the governance structures that shape how technology meets behavior.
Every fintech product embeds a theory of its user. The question is whether that theory respects the user's autonomy or exploits the user's biases.
"Fintech is not a technology problem with a technology solution. It is a design problem with a behavioral solution."
Key Takeaways
Seven Things to Remember from Lecture 2
- Growth engine: Fintech growth is sustained by four interdependent drivers — capital, technology, distribution, and demand. Remove any one and growth stalls.
- Financial inclusion: 1.7 billion adults remain unbanked. Mobile money (M-Pesa, PIX) proves inclusion is possible; predatory lending proves it is not automatic.
- Trust: Trust in financial services is multidimensional (competence, benevolence, integrity) and asymmetric (slow to build, fast to destroy).
- Behavioral barriers: Status quo bias, loss aversion, and complexity aversion explain most non-adoption — not lack of features.
- Choice architecture: Every fintech product is a designed decision environment. Defaults, frames, and social cues shape financial behavior more than information does.
- The ethical line: The boundary between a helpful nudge and a dark pattern is alignment with the user's interest, not the company's revenue.
- Inclusion-protection trade-off: The goal is Q1 (high inclusion, high protection). Most fintech sits in Q2 or Q3. Q4 is failure.
Key Vocabulary
What Comes Next
Next: Lecture 3 — Payments and Digital Money. Real-time payments, CBDC design, cross-border flows, and the behavioral economics of spending. Payments are where behavioral fintech meets everyday life — every payment interface is a choice architecture.
Before L03, reflect: Think about a financial decision you made recently. Was it shaped by a default, a frame, or a nudge? Would you have decided differently in a different interface?
Workshop preparation: Review the inclusion-protection quadrant (Section 7). You will use it to evaluate a case study in Workshop C.
L01: Foundations ✓ · L02: Ecosystem ✓ · L03: Payments · L04: Regulation · L05: Wealth Mgmt · L06: Insurance · L07: Technology
Downloads
All 6 slide variants — PDF formatAll slide variants are available for download. The full variant (31 slides) is the primary lecture document. The mini variants are useful for quick review or mobile reading.