Activity 1: Spot the Redundancy
| Student | Math | Physics | Literature |
|---|---|---|---|
| Anna | 85 | 82 | 60 |
| Ben | 72 | 70 | 78 |
| Carla | 95 | 91 | 55 |
| David | 60 | 58 | 88 |
| Eva | 78 | 75 | 72 |
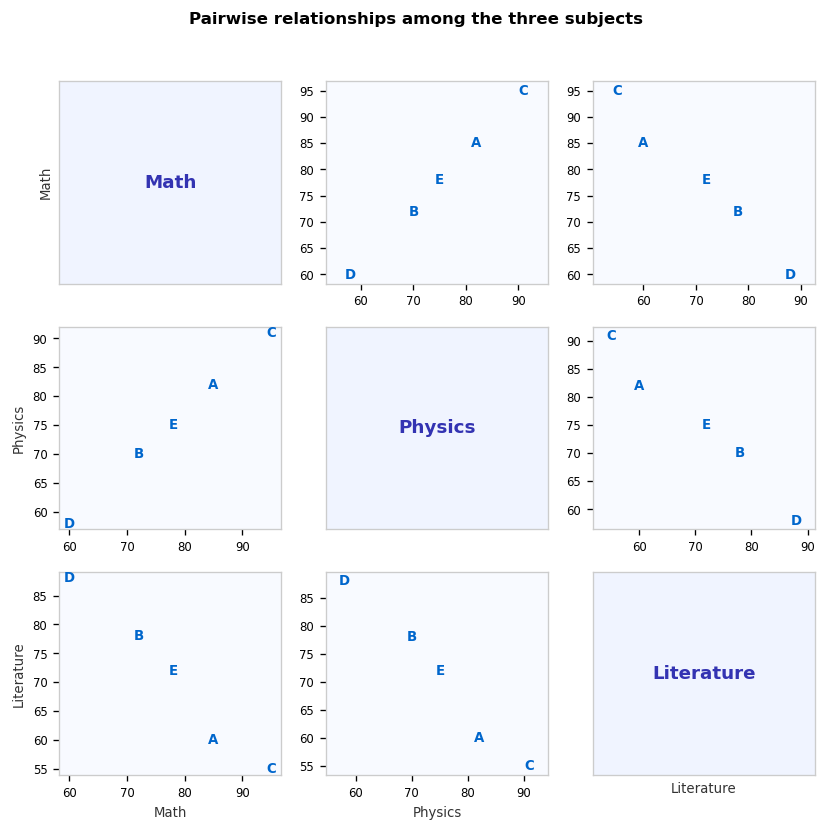
a) Which two subjects have scores that move together? When one is high, the other is also high?
b) If you could keep only ONE number per student to summarize overall performance, what would you compute?
c) Would it make sense to average Math and Literature together? Why or why not?
Show answers
a) Redundant pair
Math and Physics move together almost perfectly. When Anna scores 85 in Math, she scores 82 in Physics. When David scores 60, he scores 58. The two columns carry nearly the same information.
b) One number per student
A weighted average of the three scores, or simply the average of Math and Physics (since they agree). This single number would summarize the shared pattern. PCA does exactly this—it finds the linear combination that captures the most shared variation.
c) Averaging Math and Literature
No. They move in opposite directions for several students: Carla excels at Math (95) but scores low in Literature (55); David is the reverse (60 / 88). Averaging them would cancel the signal and produce a misleading middle value for everyone.
Activity 2: Direction of Maximum Spread
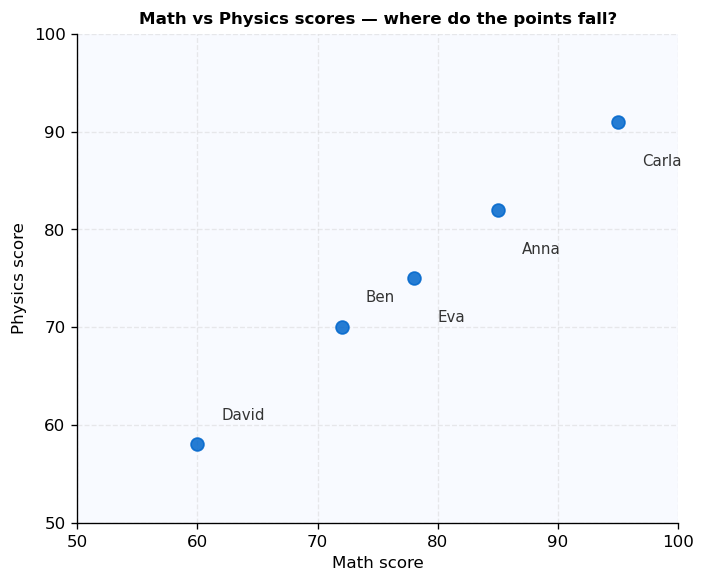
a) Sketch roughly where the five points fall. Are they spread more left–right, up–down, or diagonally?
b) Draw an arrow through the cloud showing the direction of MOST spread. This arrow is your first principal component (PC1)!
c) If you project all points onto this arrow, you get PC1 scores. How much information about the original two variables do you lose?
Show answers
a) Shape of the cloud
The points form a tight diagonal band running from bottom-left (David: 60, 58) to top-right (Carla: 95, 91). There is almost no vertical spread around the diagonal—the cloud is more elongated than it is wide.
b) Direction of PC1
The arrow points from bottom-left to top-right at roughly 45°. This direction captures the shared rise—"students who score high in one subject score high in the other."
c) Information loss
Very little. Because Math and Physics are strongly correlated, almost all variation is along the diagonal. The small scatter perpendicular to the arrow (the part you lose) is mostly noise. If the correlation were weaker, the loss would be larger.
Activity 3: Hidden Causes
a) Draw arrows on paper: Quantitative talent → which subjects? Verbal talent → which subjects?
b) This is the core idea behind Exploratory Factor Analysis (EFA). How is it different from just averaging the scores?
c) Would you use PCA or EFA if you wanted to discover which hidden abilities explain the test scores? Why?
Show answers
a) Factor arrows
Quantitative talent → Math, Physics (both arrows point away from one latent node). Verbal talent → Literature. The diagram looks like two causes producing three effects.
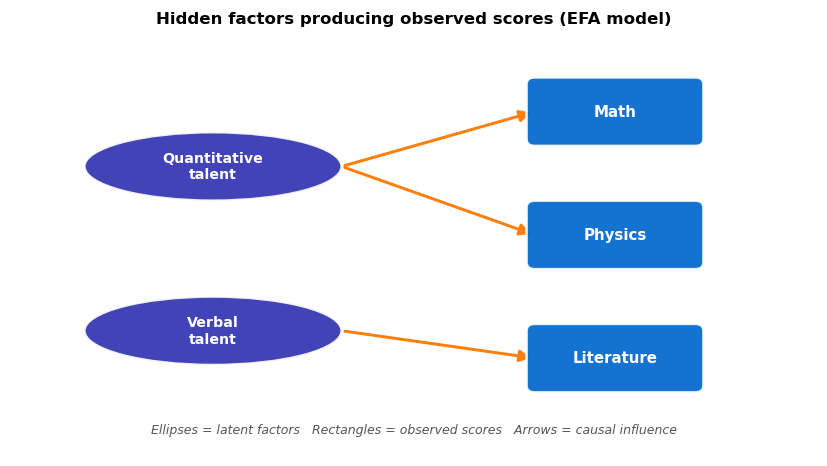
b) EFA vs. averaging
Averaging simply compresses numbers—it says nothing about why they correlate. EFA models a causal story: it postulates latent factors and estimates how strongly each observed variable reflects each factor. The result tells you the structure of the underlying abilities, not just a summary score.
c) PCA or EFA?
EFA. PCA is a data-compression tool—it finds directions of maximum variance without assuming hidden causes. EFA explicitly models latent variables (hidden causes) and is designed for questions like "what underlying factors explain why these variables correlate?"